Learn how you can Unlock Limitless Customer Lifetime Value with CleverTap’s All-in-One Customer Engagement Platform.

It’s no secret the success of an app is heavily dependent on the user experience.
Everything from app store ranking, to onboarding, to load time can make or break a user’s experience within your app. If you’re not constantly learning and enhancing your app’s CX, user retention will plummet.
The user experience is the encounter with the app itself — usability, navigation, learnability, and overall design. Customer experience is the umbrella that encompasses user experience. In other words, it is the overall interaction with all channels of a brand. From seeing and clicking an ad, to downloading the app, to making a purchase, and everything in between.
While the technical definitions may be different, the sentiment is the same — to deliver the best experience to anyone who interacts with your brand.
Customer experience metrics help you track the good and the bad of your app, so you can evaluate and improve how users engage with your app. Metrics like acquisition, engagement, customer satisfaction, and product performance help gauge what’s going well and what needs to be improved. 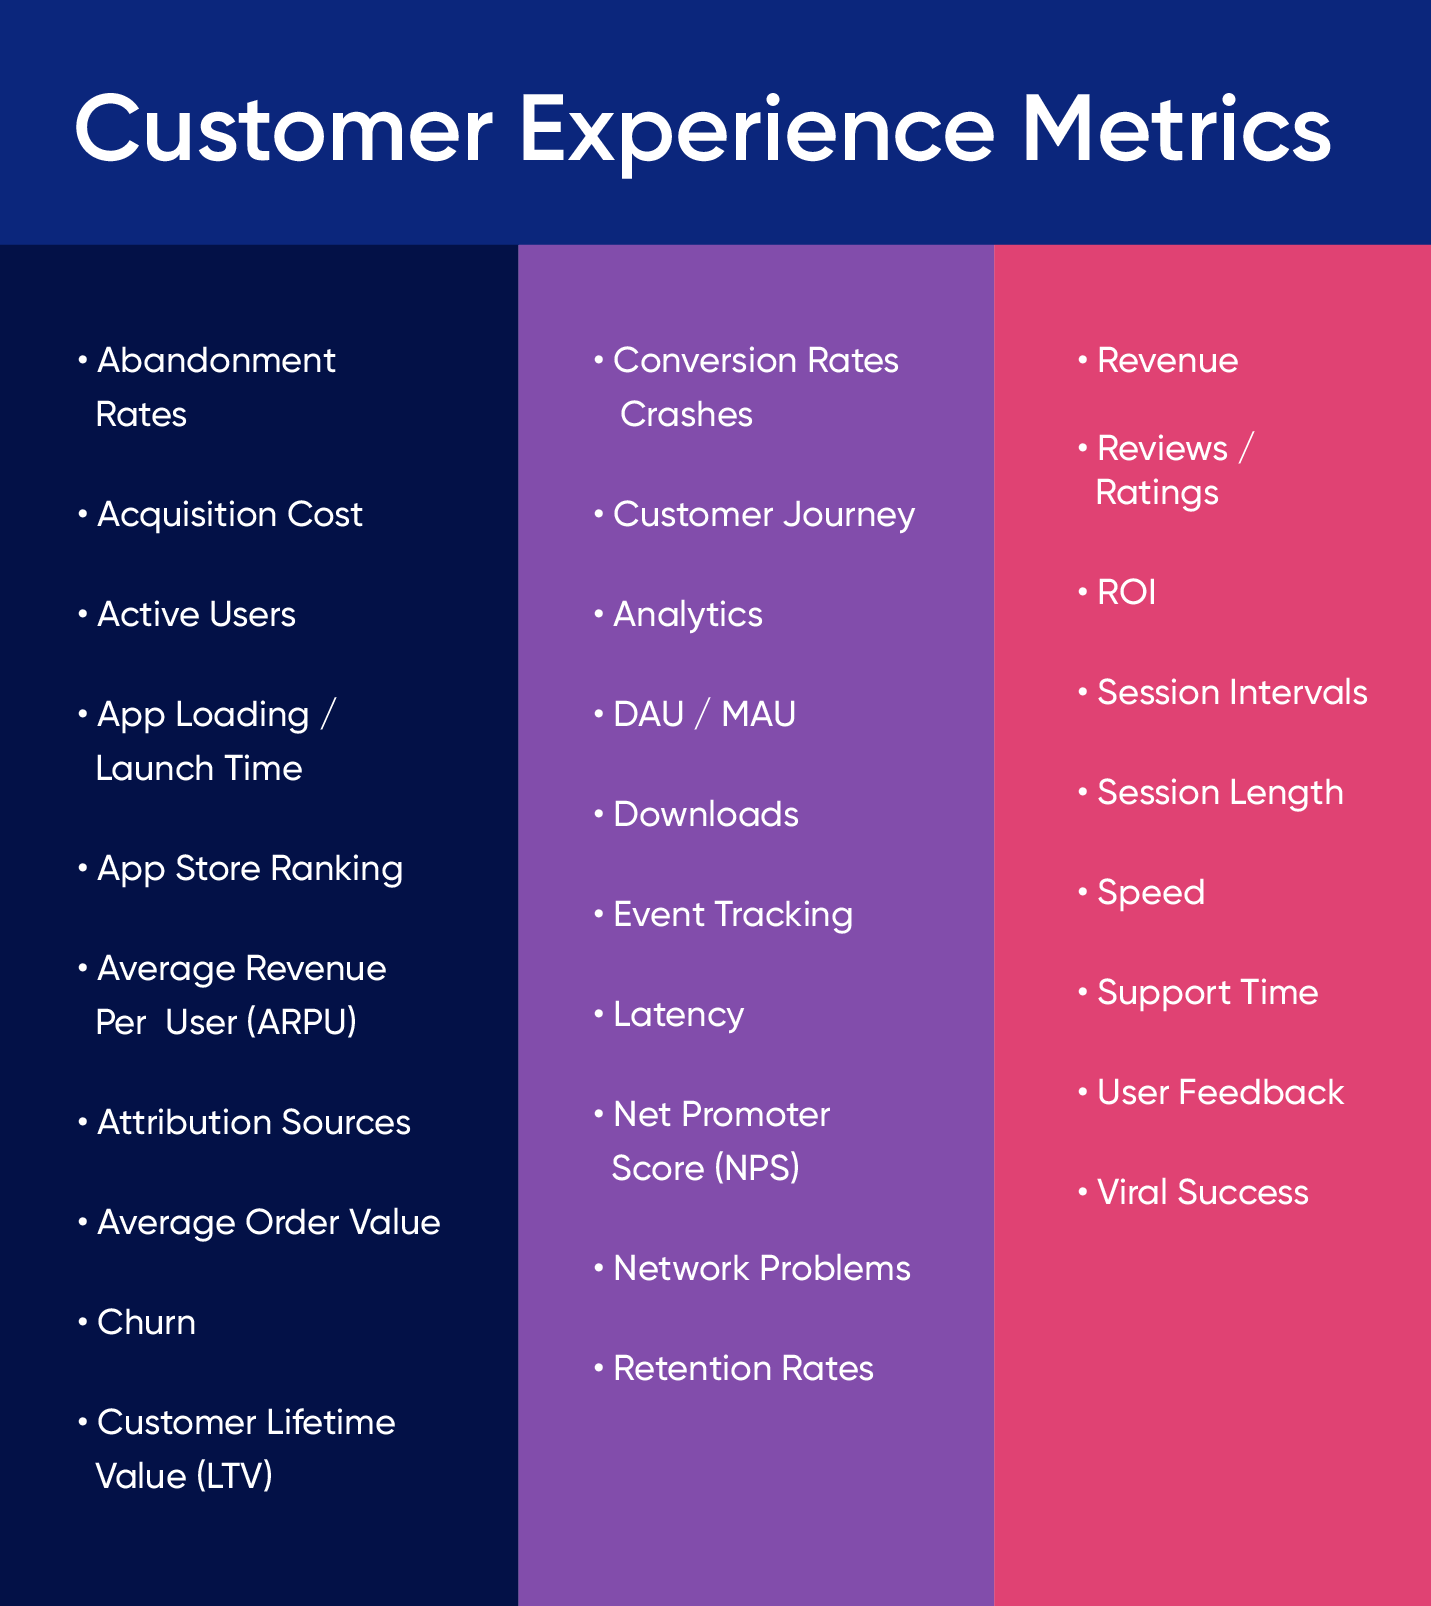
But simply tracking all these metrics isn’t enough — you have to know how to use this data effectively to make important changes and informed decisions.
That’s why we’re sharing the top metrics (and how to use them) for improving the customer experience within your app.
Think about everything that goes into acquiring a new user. Do you pay for ads? How big is your sales team? What is your marketing budget?
Now think about how those efforts translate into sales. Are your investments resulting in revenue?
To answer this, you first must calculate your Customer Acquisition Cost (CAC).
Your marketing and sales costs divided by the number of users is your approximate acquisition cost. 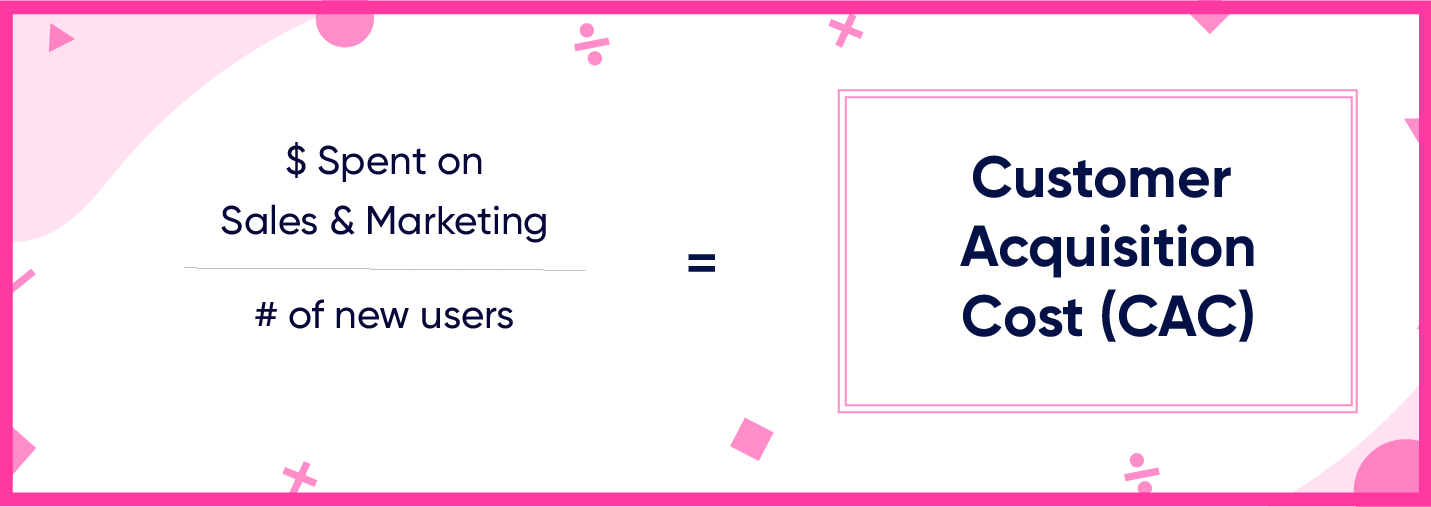
For example, let’s say a food delivery app spends $50,000 in marketing/sales in a month and had 1,000 customers order delivery from the app — their CAC would be $50.
Next, you calculate your Customer Lifetime Value (LTV).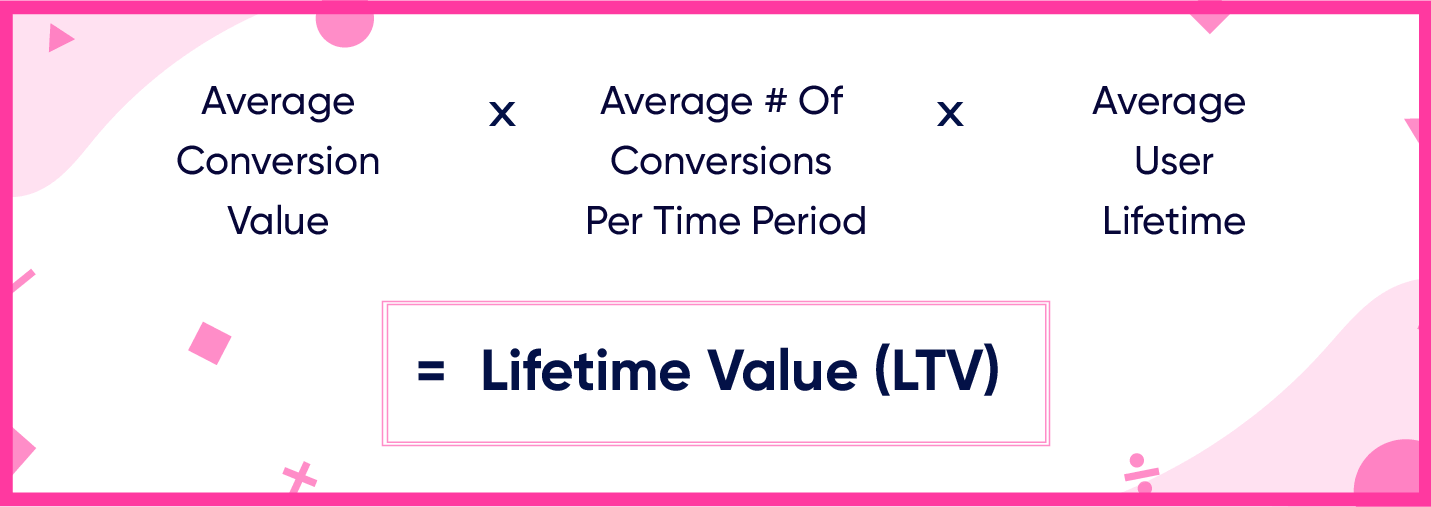
The purpose of calculating CAC and LTV is to determine whether your marketing and sales investments are turning a profit. The ultimate goal is to decrease CAC and increase LTV.
Let’s say this same food delivery app finds most customers only convert twice before they churn and calculate their LTV to be $30. So for every $50 they’re spending on acquiring new customers, they’re losing $20. Womp womp.
In this scenario, if the food delivery app were to keep spending the same amount on acquisition, they’d go out of business.
Don’t let this scare you. Understanding CAC and LTV can give you an opportunity to increase conversions and improve retention.
A/B testing ads and learning which ones deliver a greater number of app installs with a low CPI can decrease your CAC.
Implementing different checkout flows or sending push notifications to remind your users when they added something to their cart can reduce shopping cart abandonment and increase your LTV.
How much a customer is spending within your app is a pretty good indication of the customer experience.
Average Revenue Per User (ARPU) helps determine the value of your users by calculating the average amount of money each user spends within your app. 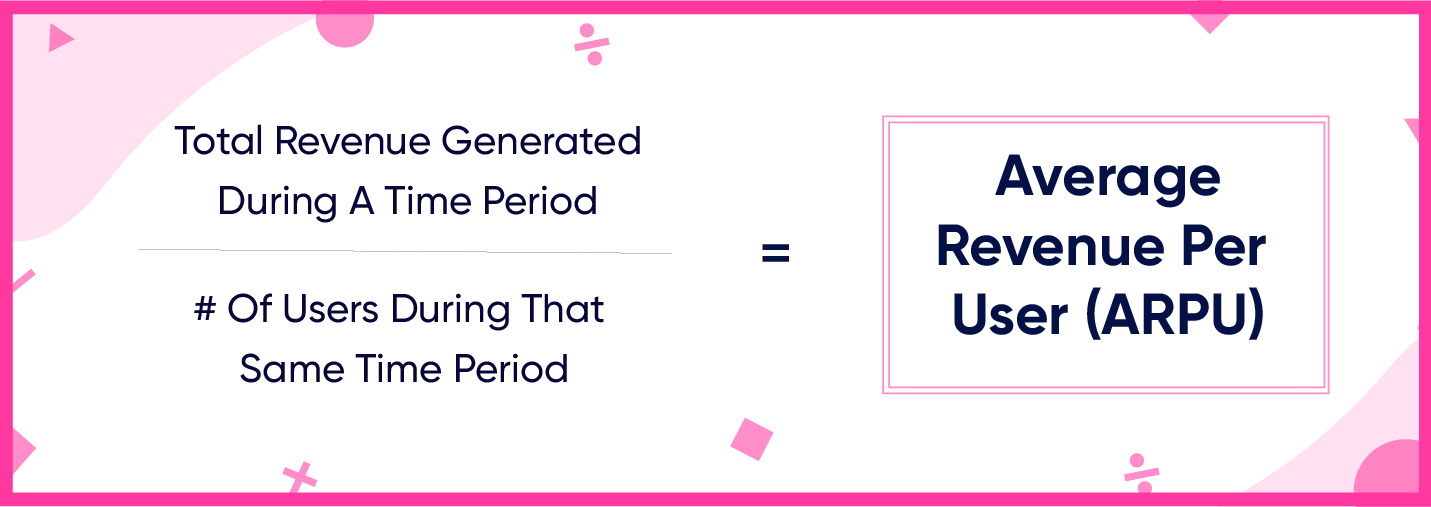
ARPU helps you track the performance of users, forecast growth, and identify which monetization models work best for your app based on the spending habits of your users.
This is not to say purchase frequency is more desirable than purchase value. For example, if User A is spending $10 every month vs. User B who is spending $200 a year, User B has a much higher ARPU than User A.
Improving your ARPU can lower CAC costs and help you anticipate the growing needs of your users. To increase your ARPU, identify ways to encourage your users to spend more within your app — such as subscription upgrades and tiered pricing plans.
It’s inevitable that customers will come and go, but tracking churn helps identify why your users are jumping ship.
Customer churn rate is calculated by looking at the number of customers lost during a time period and dividing it by the total number of acquired customers at the beginning of that time period. 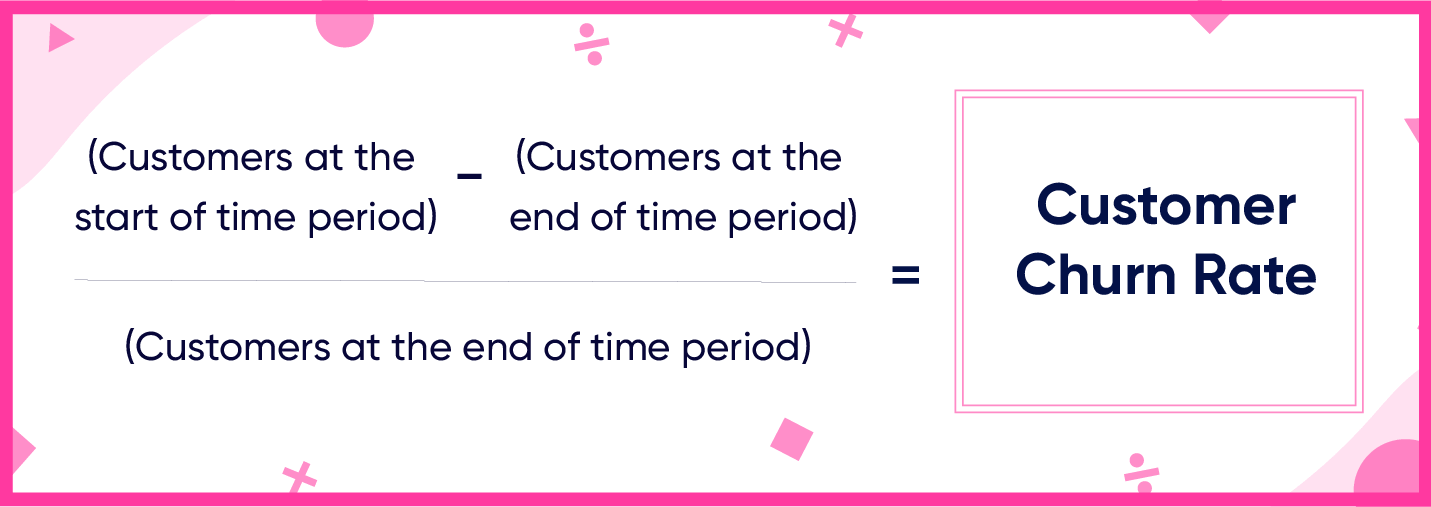
Why should you care about churn?
Because the probability (and profitability) of selling to an existing customer is a lot higher than selling to a new one. In fact, it can be anywhere from 5 to 25x more expensive to acquire a new customer than it is to keep a current one1.
Tracking this metric not only helps determine what actions and asks are leading users to churn but also which customers and segments are most valuable for your business.
Downloading an app is just the first step in the customer journey. What is the ultimate goal of using your app? To purchase a product or service?
When and how your users convert can heavily influence the customer experience. If your users are downloading but not converting, what’s the point?
Conversion funnel analysis helps you understand how people are interacting with your app — and more specifically, where users are dropping off.
Let’s take a look at these two app conversion funnels below. App A has mostly new users with very little returning users and customers. App B has the opposite — a high number of customers with very little new and returning users. 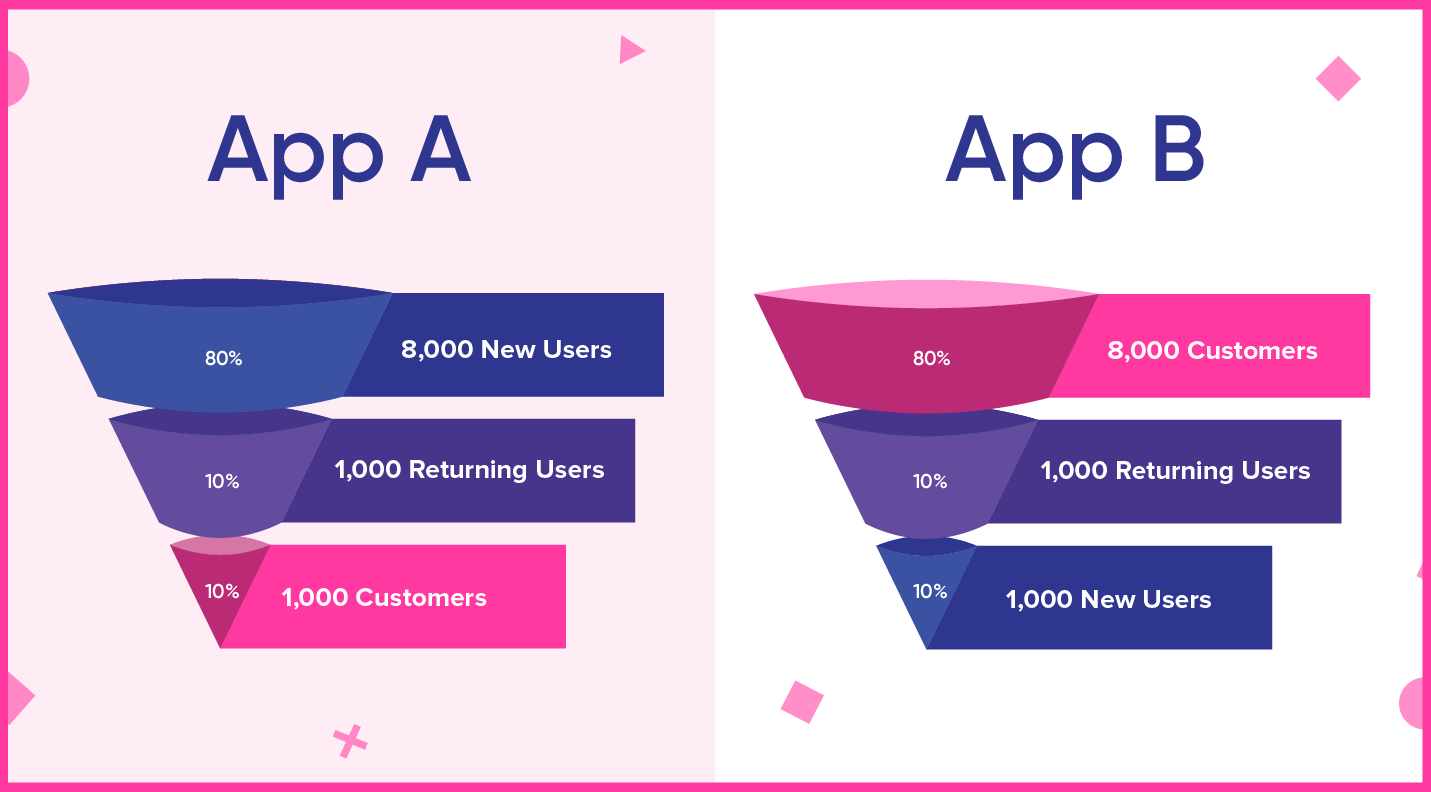
Without knowing anything about the product, this already tells us a lot about both apps.
App A seems to acquire new users fairly easily but struggles with not only retaining them but converting them as well. App A should look into their onboarding process and UI to find out where new users are losing interest.
App B seems to have a very viable product since most of its users convert, but their acquisition and retention numbers are low. This app should either increase the marketing budget or explore different acquisition channels to support awareness and growth. This app could also benefit from improving its user onboarding to dive deeper into the product benefits (since users seem to love it) or look into offering additional features to boost retention.
You know how many installs you’ve had, but not how often users are coming back. Tracking daily and monthly active users (DAU/MAU) measures how many and how often users return to your app.
DAU
This metric is useful because it tracks usage by individual vs. sessions. That means if one user logs into your app once a day and another user logs in 20 times a day, the DAU for each user would only be one time. 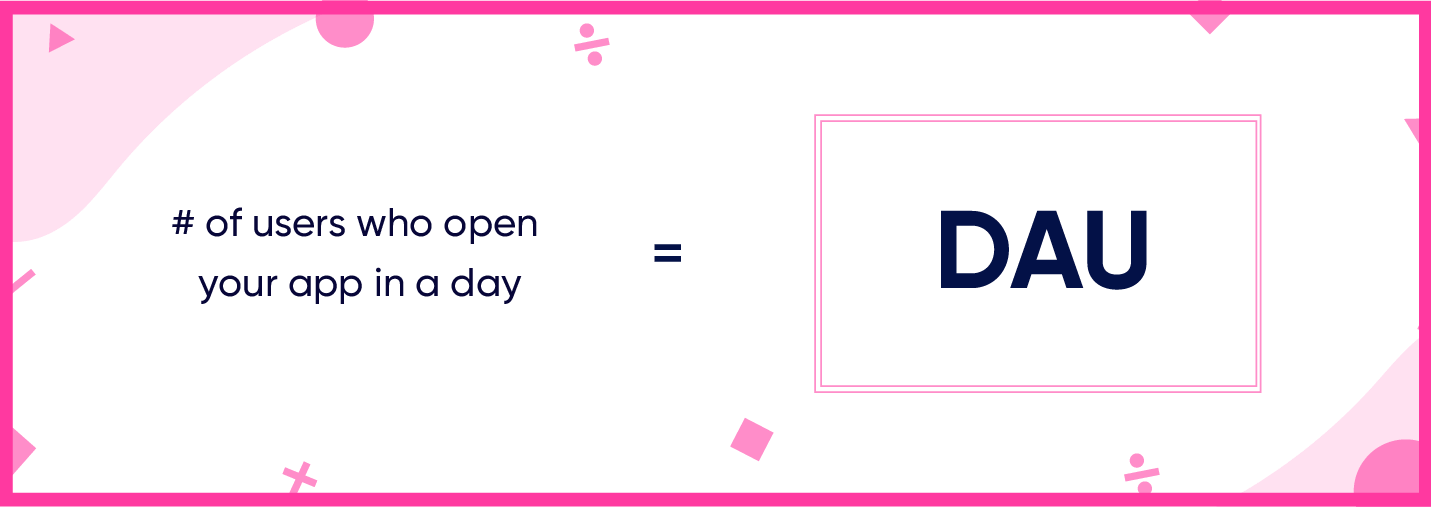
MAU
Similar to DAU, this tracks how many users log into your app within a 30-day timeframe. So if 20,000 users logged into your app for a total of 100,000 times within 30 days, your MAU would be 20,000. 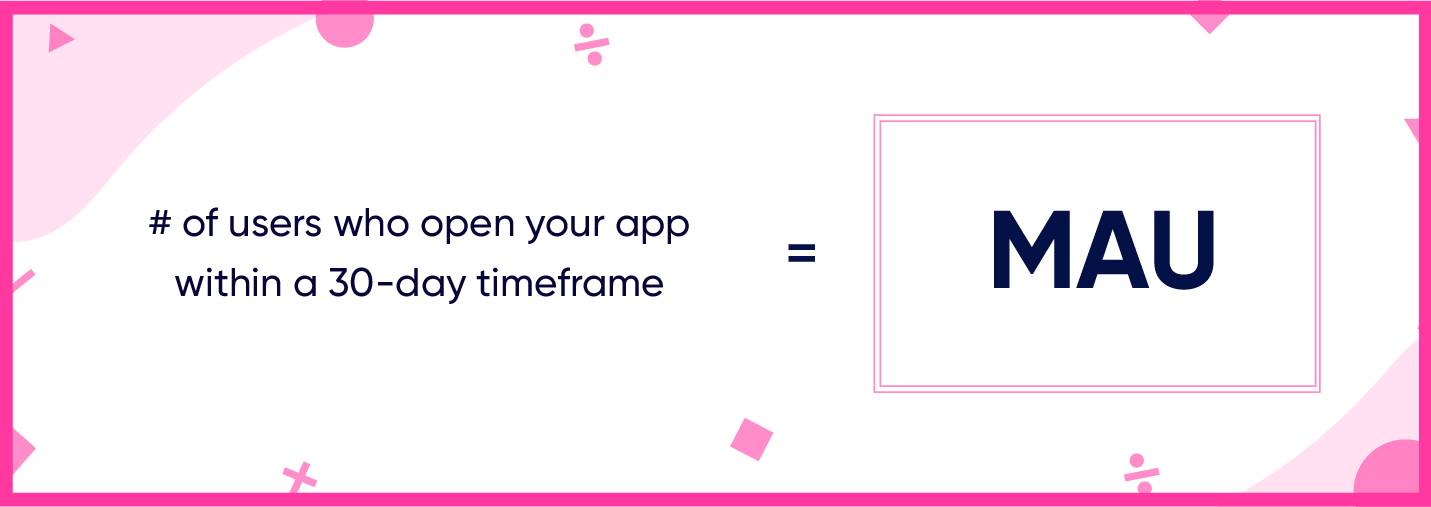
Stickiness
Stickiness uses the calculations from DAU and MAU to determine how often users are returning to your app.
DAU/MAU = Stickiness %
The closer your DAU and MAU numbers are to each other, the better. For example, if your DAU is 5,000 and your MAU is 10,000 your stickiness would be 50%. 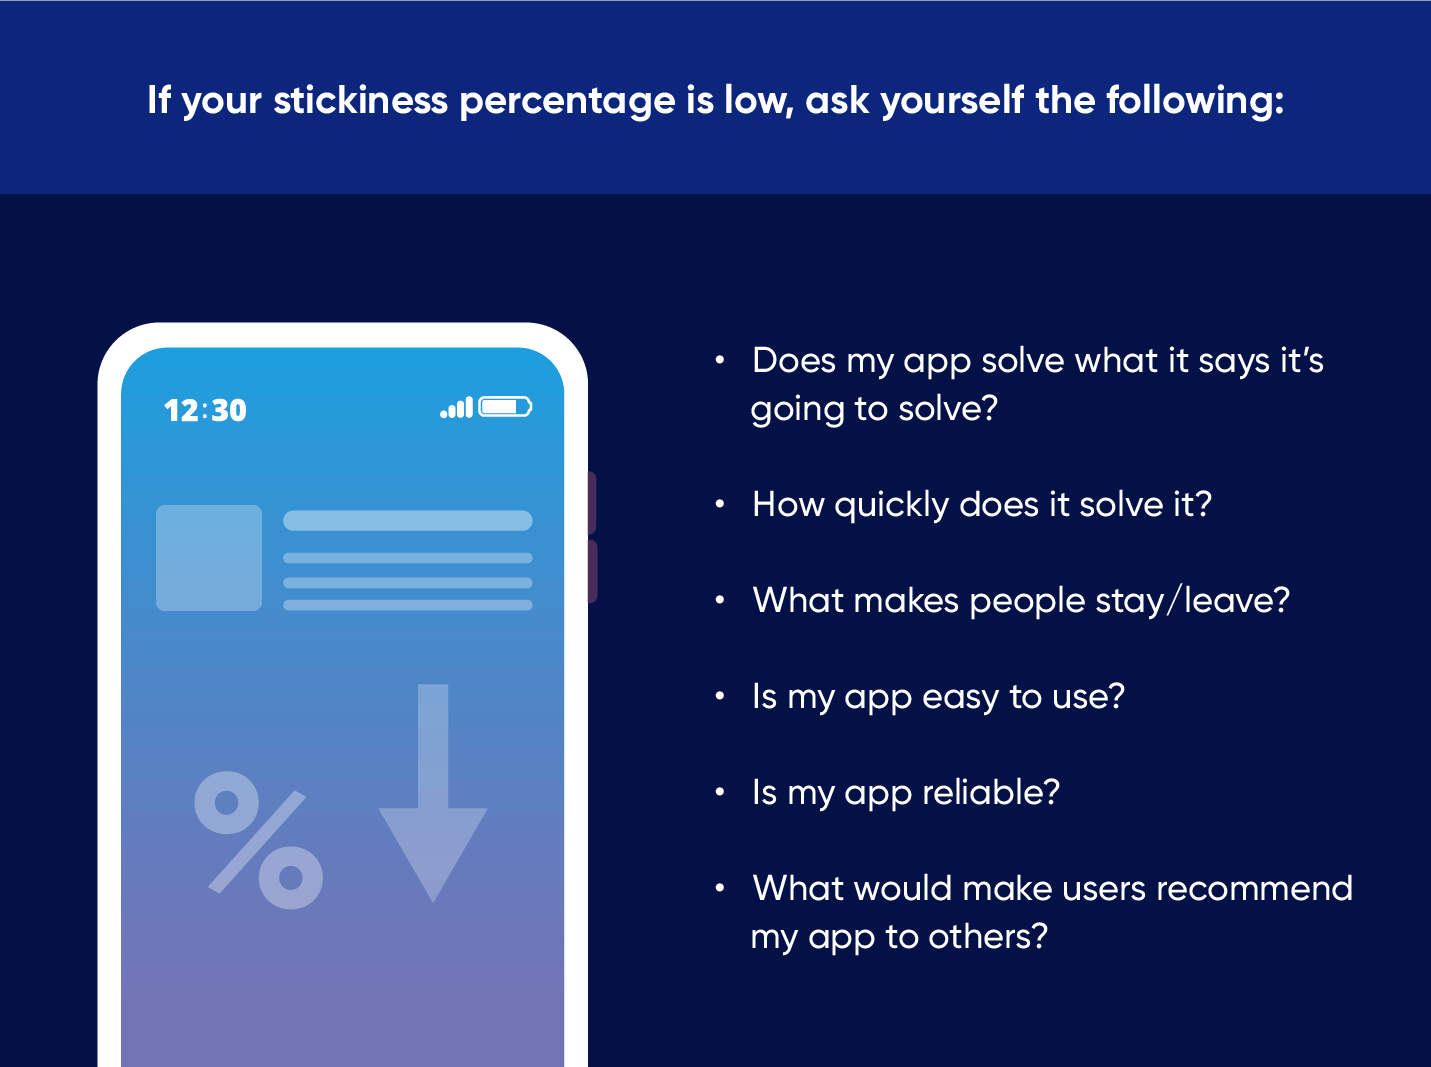
Probably the most popular, and most controversial, customer experience metric is Net Promoter Score (NPS). This tactic measures the viral success of your app. That is, how likely a user would recommend your app to a friend.
As scientific as the name may suggest, implementing this metric is very simple. Just ask your users!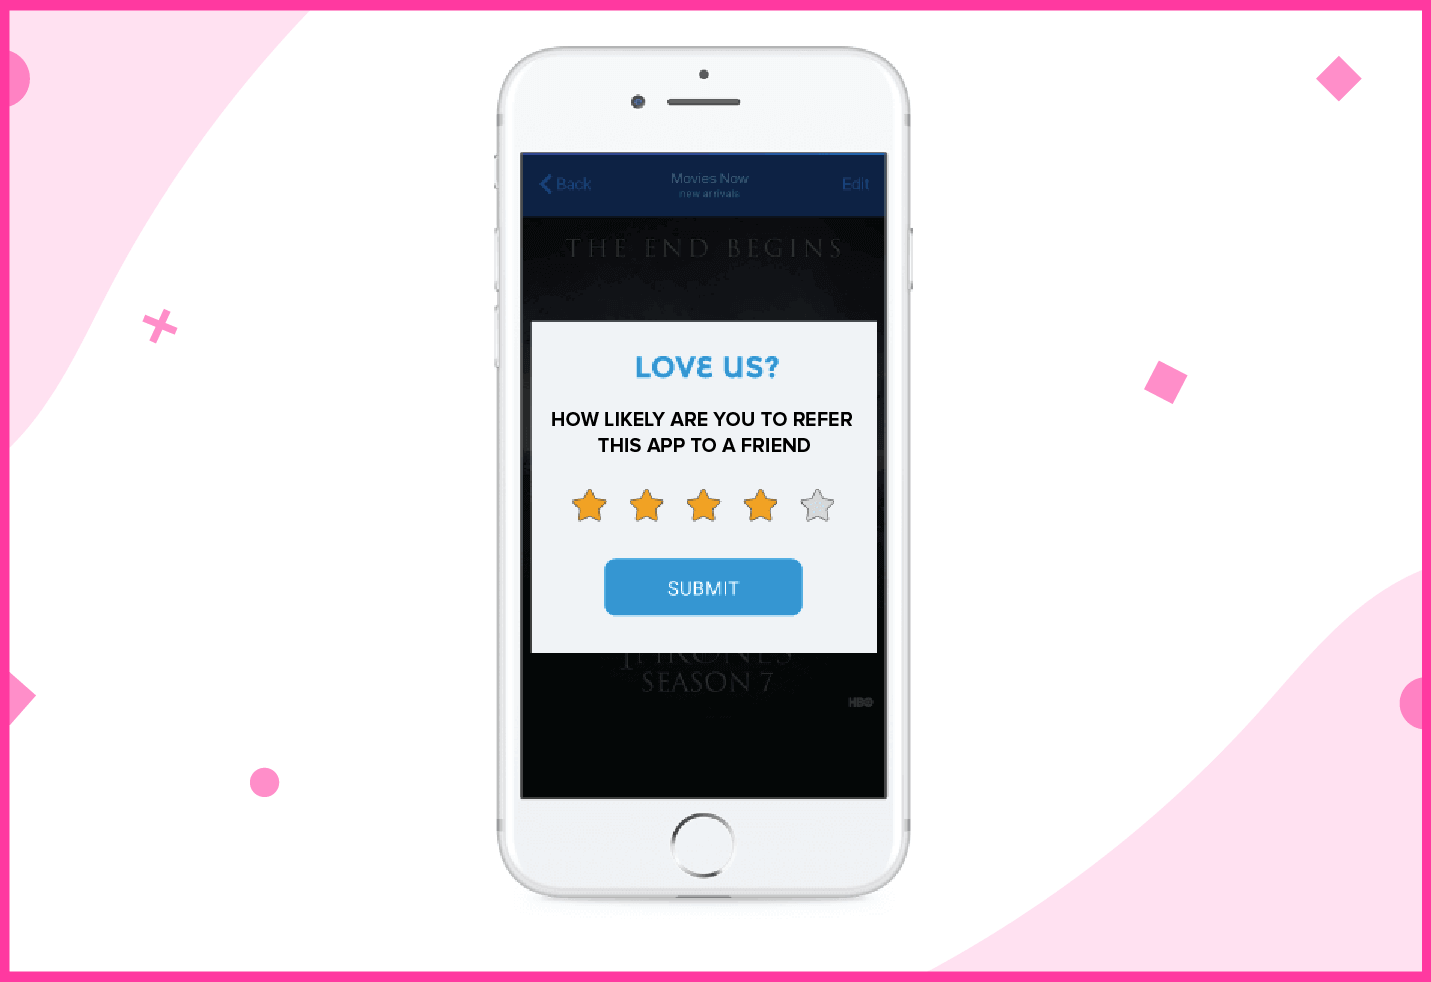
Make this language as straightforward as possible. If you confuse your users, they’ll ignore it.
Not all industry NPS scores are created equal. For example, someone who shops using an ecommerce app, like Sephora, would be more likely to recommend that app to a friend over an app that they use for work, like Slack.
| Industry | Companies | Average NPS Metric |
|---|---|---|
| Consumer Brands/Entertainment | Pandora, Spotify, Netflix | 19 |
| Technology/Software | Microsoft, Oracle, Mailchimp | 56 |
| Consumer Brands/Fast Food | Starbucks, KFC, McDonald’s | 40 |
| Computer Software | Adobe, Autodesk, Symantec | 0 |
A downside (or possibly an upside) of NPS is the results are not shared publicly. So if you find you have a good NPS score, contests and giveaways are a great incentive to promote positive experiences and drive awareness on social media.
Uh-oh, something went wrong. Ideally, this won’t happen — but if it does, how long does it take your users to get ahold of support?
The amount of time it takes from submitting a support request to connecting with a customer service representative can greatly impact your customer experience.
Does it take a day? More?
Perhaps you should set customer expectations by telling them when a rep will contact them or add in a support bot to get in touch sooner. When done right, chatbots can expedite the support experience and solve the problem instantly, rather than waste time waiting for an available representative.
Tracking common issues or questions is a good indication of what should be improved on the development side. If you’re getting a ton of questions around something that should be straightforward, like building a profile, it’s probably leading to churn. Use these repetitive questions as an opportunity to improve the UI of your app.
And direct users to content that shows them how to do it so these issues don’t clog up the support pipeline.
How long do users spend on your app? And how long between sessions?
A common belief is “the longer the average session length, the better.” This isn’t exactly true.
The secret to retention is delivering value to your users as soon and as often as possible. Would you rather have a user who spends hours and hours in your app but never converts — or a user who launches your app and converts within minutes? My guess is the latter.
Session length can also vary greatly depending on what industry you’re in.
For example, the time spent on an ecommerce app can be seconds if the user knows what they want vs. hours spent on a movie or music streaming app. 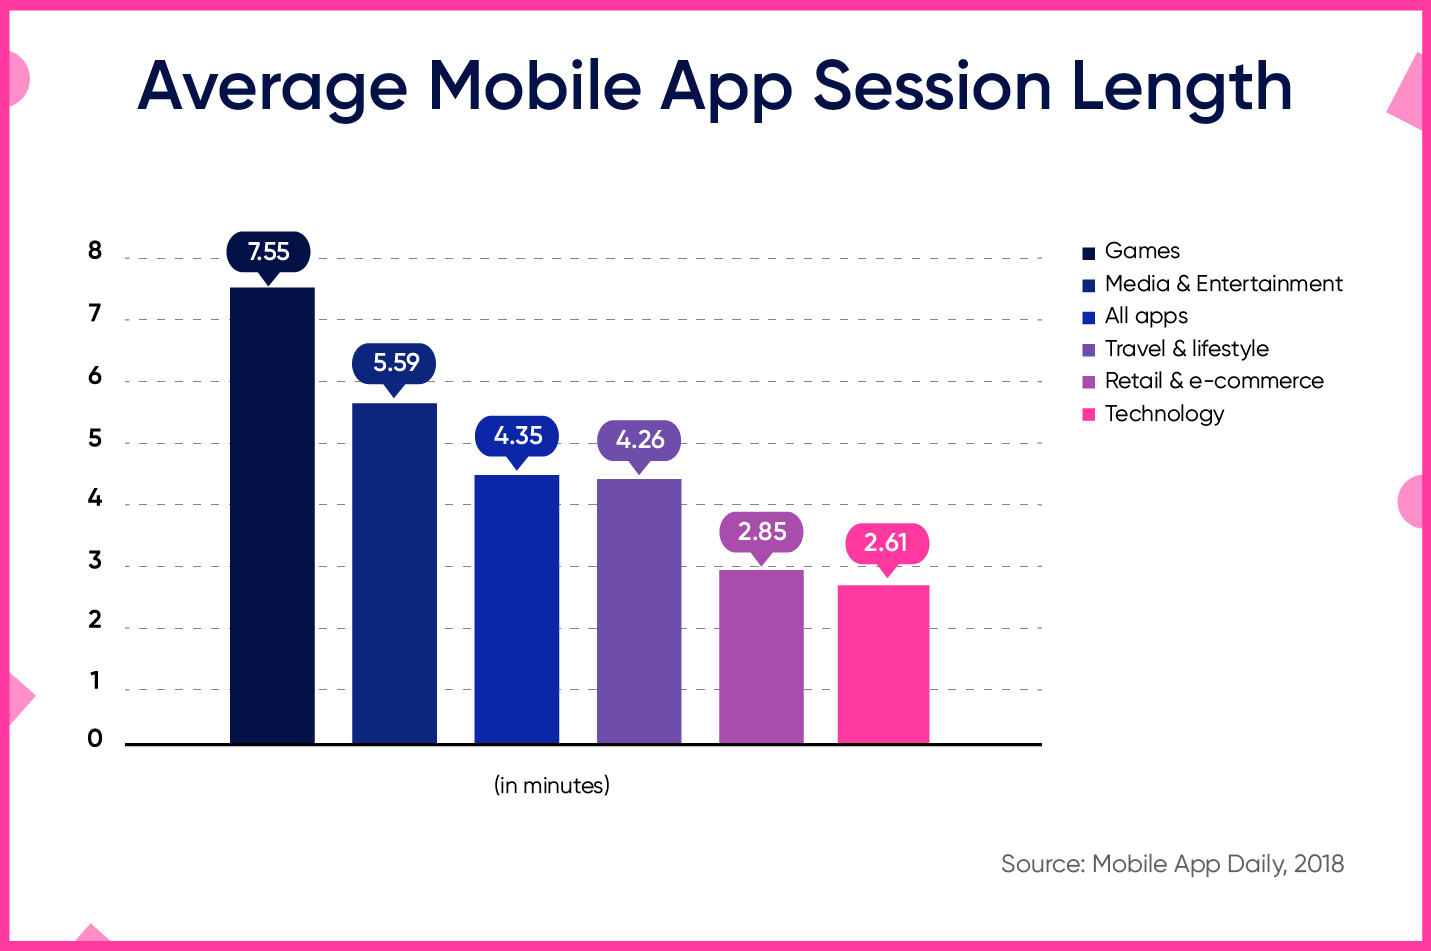
This metric also helps highlight what time of day users are more likely to use your app. For example, if you’re a cooking app, users might be jumping into your app around mealtime.
The shorter the amount of time between sessions, the better. This means that your app is indispensable to your users and possibly becoming a part of their daily routine (a.k.a. the Holy Grail of Mobile App Optimization).
Sometimes the best metric for customer success is the most obvious one: how does your app rank in the app store?
The app store rankings and ratings allow users to rate their overall satisfaction with your app.
If you wish to dig deeper into your ratings, there are several channels where you can request additional feedback. If it’s just a simple question like asking users to rank your app, a push notification is a great way to get users to provide feedback while they have your app top of mind.
As you make adjustments to your app based on customer feedback, advertise it! Customers love to hear when you’re listening to their ideas and suggestions and it could motivate users to participate in future feedback requests.
There is no one-size-fits-all customer experience metric that will tell you what to fix within your app. These metrics simply provide a number that helps you make the best decisions and improvements within your app.
Continuously tracking and evaluating the way you engage your users keeps your app from growing stale and customers from churning. Learning more about your users allows you to personalize their experience within your app.
CleverTap helps you gain user insights and build targeting campaigns across various channels to encourage engagement and boost user retention.
See how today’s top brands use CleverTap to drive long-term growth and retention


![What Are Push Notifications? The Ultimate Guide[2024]](https://clevertap.com/wp-content/uploads/2021/05/Push-Notification-Header.png?w=1024)