
Quantification of Food Losses and Waste in Peru: A Mass Flow Analysis along the Food Supply Chain


1
Escuela de Ingeniería Agroindustrial, Universidad Nacional de Moquegua (UNAM), Moquegua 18001, Peru
2
Faculdade de Veterinária, Universidade Federal Fluminense, Niterói 24220-000, Brazil
*
Author to whom correspondence should be addressed.
Sustainability 2021, 13(5), 2807; https://doi.org/10.3390/su13052807
Submission received: 6 January 2021
/
Revised: 22 February 2021
/
Accepted: 24 February 2021
/
Published: 5 March 2021
Abstract
:The quantification of food losses and waste (FLW) has become a research hotspot in the last decade, but little work has been done to have food waste data in Latin American countries. This paper contributes to addressing this knowledge gap by examining the magnitude of FLW along the whole food supply chain (FSC) in Peru. The methodological approach was based on the top-down mass flow analysis at all steps of the FSC for the 2007–2017 period (most recently available data), including different food commodity groups (CGs), such as cereals, roots and tubers, oil seeds and pulses, fruits, vegetables, meat, fish and seafood, and milk. Results show an annual average of FLW of 12.8 million tonnes, which represents 47.76% of the national food supply. Regarding per capita quantities, the average amount of FLW was 426.56 kg per year when considering the entire FSC, and 67.34 kg per year when considering only the consumption step. This study suggests which steps of the FSC and CGs are the most promising targets for FLW reduction strategies in Peru.
1. Introduction
The last decade has witnessed a rapidly growing number of studies on the quantification of food loss and waste (FLW) in various regions around the globe. This trend is due to FLW importance in achieving food and nutrition security [1,2,3], to help tackle food poverty [4], and to improve the environmental footprint of countries [5,6]. There is now a broad consensus on two key issues that need to be addressed: the need for research to focus on generating more data on the amount of FLW outside the current focus area (U.S. and Europe) [7,8], and the need to fully capture estimates of FLW along the complete food supply chain (FSC) [9]. Accordingly, this research aims to contribute to the current scientific literature on FLW in Latin America by calculating the distribution of FLW along the FSC in Peru.
So far, little work has been done to have FLW data in Latin American countries, even though hunger is still present [10] and the diet intake quality of crucial food groups commonly related to chronic diseases is deficient [11,12]. Part of this knowledge comes from a study that used aggregated data for 2007 to investigate the per capita quantity of FLW generated in the region, resulting in around 225 kg [13]. Another type of study conducted interviews and surveys with different stakeholders to measure the quantity of food wasted during the early and middle stages of the FSC—as in the case of beans and maize value chains in Guatemala and Honduras [14], potato value chains in Ecuador and Peru [14,15], or tomato value chain in Colombia [16]. Surveys also were used to study household food waste, as in Uruguay [17].
On the one hand, estimating FLW for individual products at different stages of the value chain can help identify better strategies for implementing food waste management policies [18]. However, quantifying FLW is quite complicated due to technical challenges and the lack of a precise quantification methods, mainly if the wide variety of agricultural products is considered. For instance, collecting primary data (e.g., based on survey responses, manual collection methods, using mobile apps or digital images) is faster at the domestic and foodservice levels than at the production level and can be very costly in time and money [19].
On the other hand, policy decisions related to FLW reduction depend on where in the FSC most food is lost or wasted. Therefore, it is becoming increasingly crucial for the national statistical systems to embrace food loss data along the FSC, as emphasized in FAO’s SOFA (the State of Food and Agriculture) [10]. Past experiences of FLW accounting and food supply chains in the European Union have shown that the studies based on different methodological approaches and data sources limit the possibility of comparing results between countries within the region [20].
In the case of Latin America, however, only one study has reported the total FLW generated throughout the whole FSC from the Brazilian case [21]. Replicating this methodological approach to estimate how much food is lost and wasted in the region could allow us to make comparisons between countries. Thus, it serves as the basis for the FLW quantification in Peru.
Peru is among the countries the UN classifies as both a “developing” and an “upper middle income” country [22], and it recently has implemented a new law (Law N° 30988) to reduce FLW at all stages of the FSC [23]. Although the magnitude of FLW generated in the country still needs to be addressed, several studies conducted in Peru contribute to an understanding of reasons for food waste generation, considering that FLW in the so-called developing countries is influenced by urbanization and the contraction of the agricultural sector, dietary transition and the increased globalization of trade [2].
Drivers for food waste generation in Peru can be associated with the following: climatic conditions in highlands [15]; the immense diversity of supply channels in formal and informal food chains, such as dairy [24], and grain supply chain [25]; the lack of cold chain logistics in the fisheries and freshwater aquaculture [26,27]; the impact of rural road connectivity on farming activities [28]; the unequal relations between food stakeholders or market inconsistency due to quality requirements [29]; and others.
Because of all this, the present study is one of the first to address the problem of FLW generation in Peru. This research is imperative because quantifying the magnitude of FLW that targets different stages of the supply chain is crucial to support food security policies and enables setting baselines to measure change over time. A famous adage says, “you cannot manage what cannot be measured”. Consistent with this, the following key research questions are explored: How much food is lost and wasted in Peru, and how is it distributed in FSC? What food groups are lost and wasted most in Peru? How much food is lost and wasted in Peru? How much FLW is generated at the consumer level, and what is the per capita amount of FLW in Peru?
2. Materials and Methods
2.1. Research Scope
Definitions of “food loss” and “food waste” are not universal, which has been extensively discussed by Chaboud and Daviron [30]. The distinction between both terms is because the stakeholders involved in the FSC. Food losses occur at production, post-harvest, and processing steps. This refers to the decrease in the quantity or quality of food resulting from food suppliers’ decisions and actions in the chain. Instead, food waste decreases the quantity or quality of food at the end of the food chain, resulting from decisions and actions by retailers, food services, and consumers [2,10,13]. For this study, however, the masses of food lost and wasted are analyzed together because the purpose of this paper is not to identify the causes of FLW definitively; instead, it is to determine the total quantity of FLW along the FSC.
Because the national supply of food is analyzed, it is essential to consider the international food trade flows to quantify food availability variations at every step of the Peruvian FSC. Thus, the estimation of FLW was based on the top-down mass flow analysis, following Dal’ Magro and Talamini’s methodological approach [21]. They used this methodology to estimate the magnitude of the FLW in the Brazilian FSC, in the same line as Oelofse and Nahman [31]. They calculated the quantity of FLW in the FSC in South Africa.
Mass flow analysis is based on the law of the conservation of matter. It has become an important tool in waste management because it allows comparing all inputs, stocks, and outputs of a process [32]. Adelodun and Choi [33] recently used the same methodological approach to study food waste along the supply chain in Korea.
2.2. Data
The Peruvian-specific data, including domestic food production, food trade (import and export food quantity), and stock variation, were obtained from FAO Food Balance Sheets [34]. Given that Peru’s latest accessible data is dated from 2007 until 2017, the status of FLW over eleven years was examined. These data are summarized in Supplementary Table S1. FAO Food Balance Sheets have been used to quantify FLW in many investigational studies, among them the most highly cited studies on FLW to date: Gustavsson et al. [13] and Kummu et al. [35].
On this basis, the FSC was divided into five steps, including (i) agricultural production, (ii) post-harvest handling and storage, (iii) processing and packaging, (iv) distribution, and (v) consumption at the household level. On the same basis, the following seven food commodity groups (CGs) were considered: (i) cereals, (ii) roots and tubers, (iii) oil seeds and pulses, (iv) fruits and vegetables, (v) meat, (vi) fish and seafood, and (vii) milk. Food crop products in each CG are in the Supplementary Table S2. Only pulses were considered for the CG oil seeds and pulses due to the lack of complete oil seeds data.
2.3. Estimation of FLW
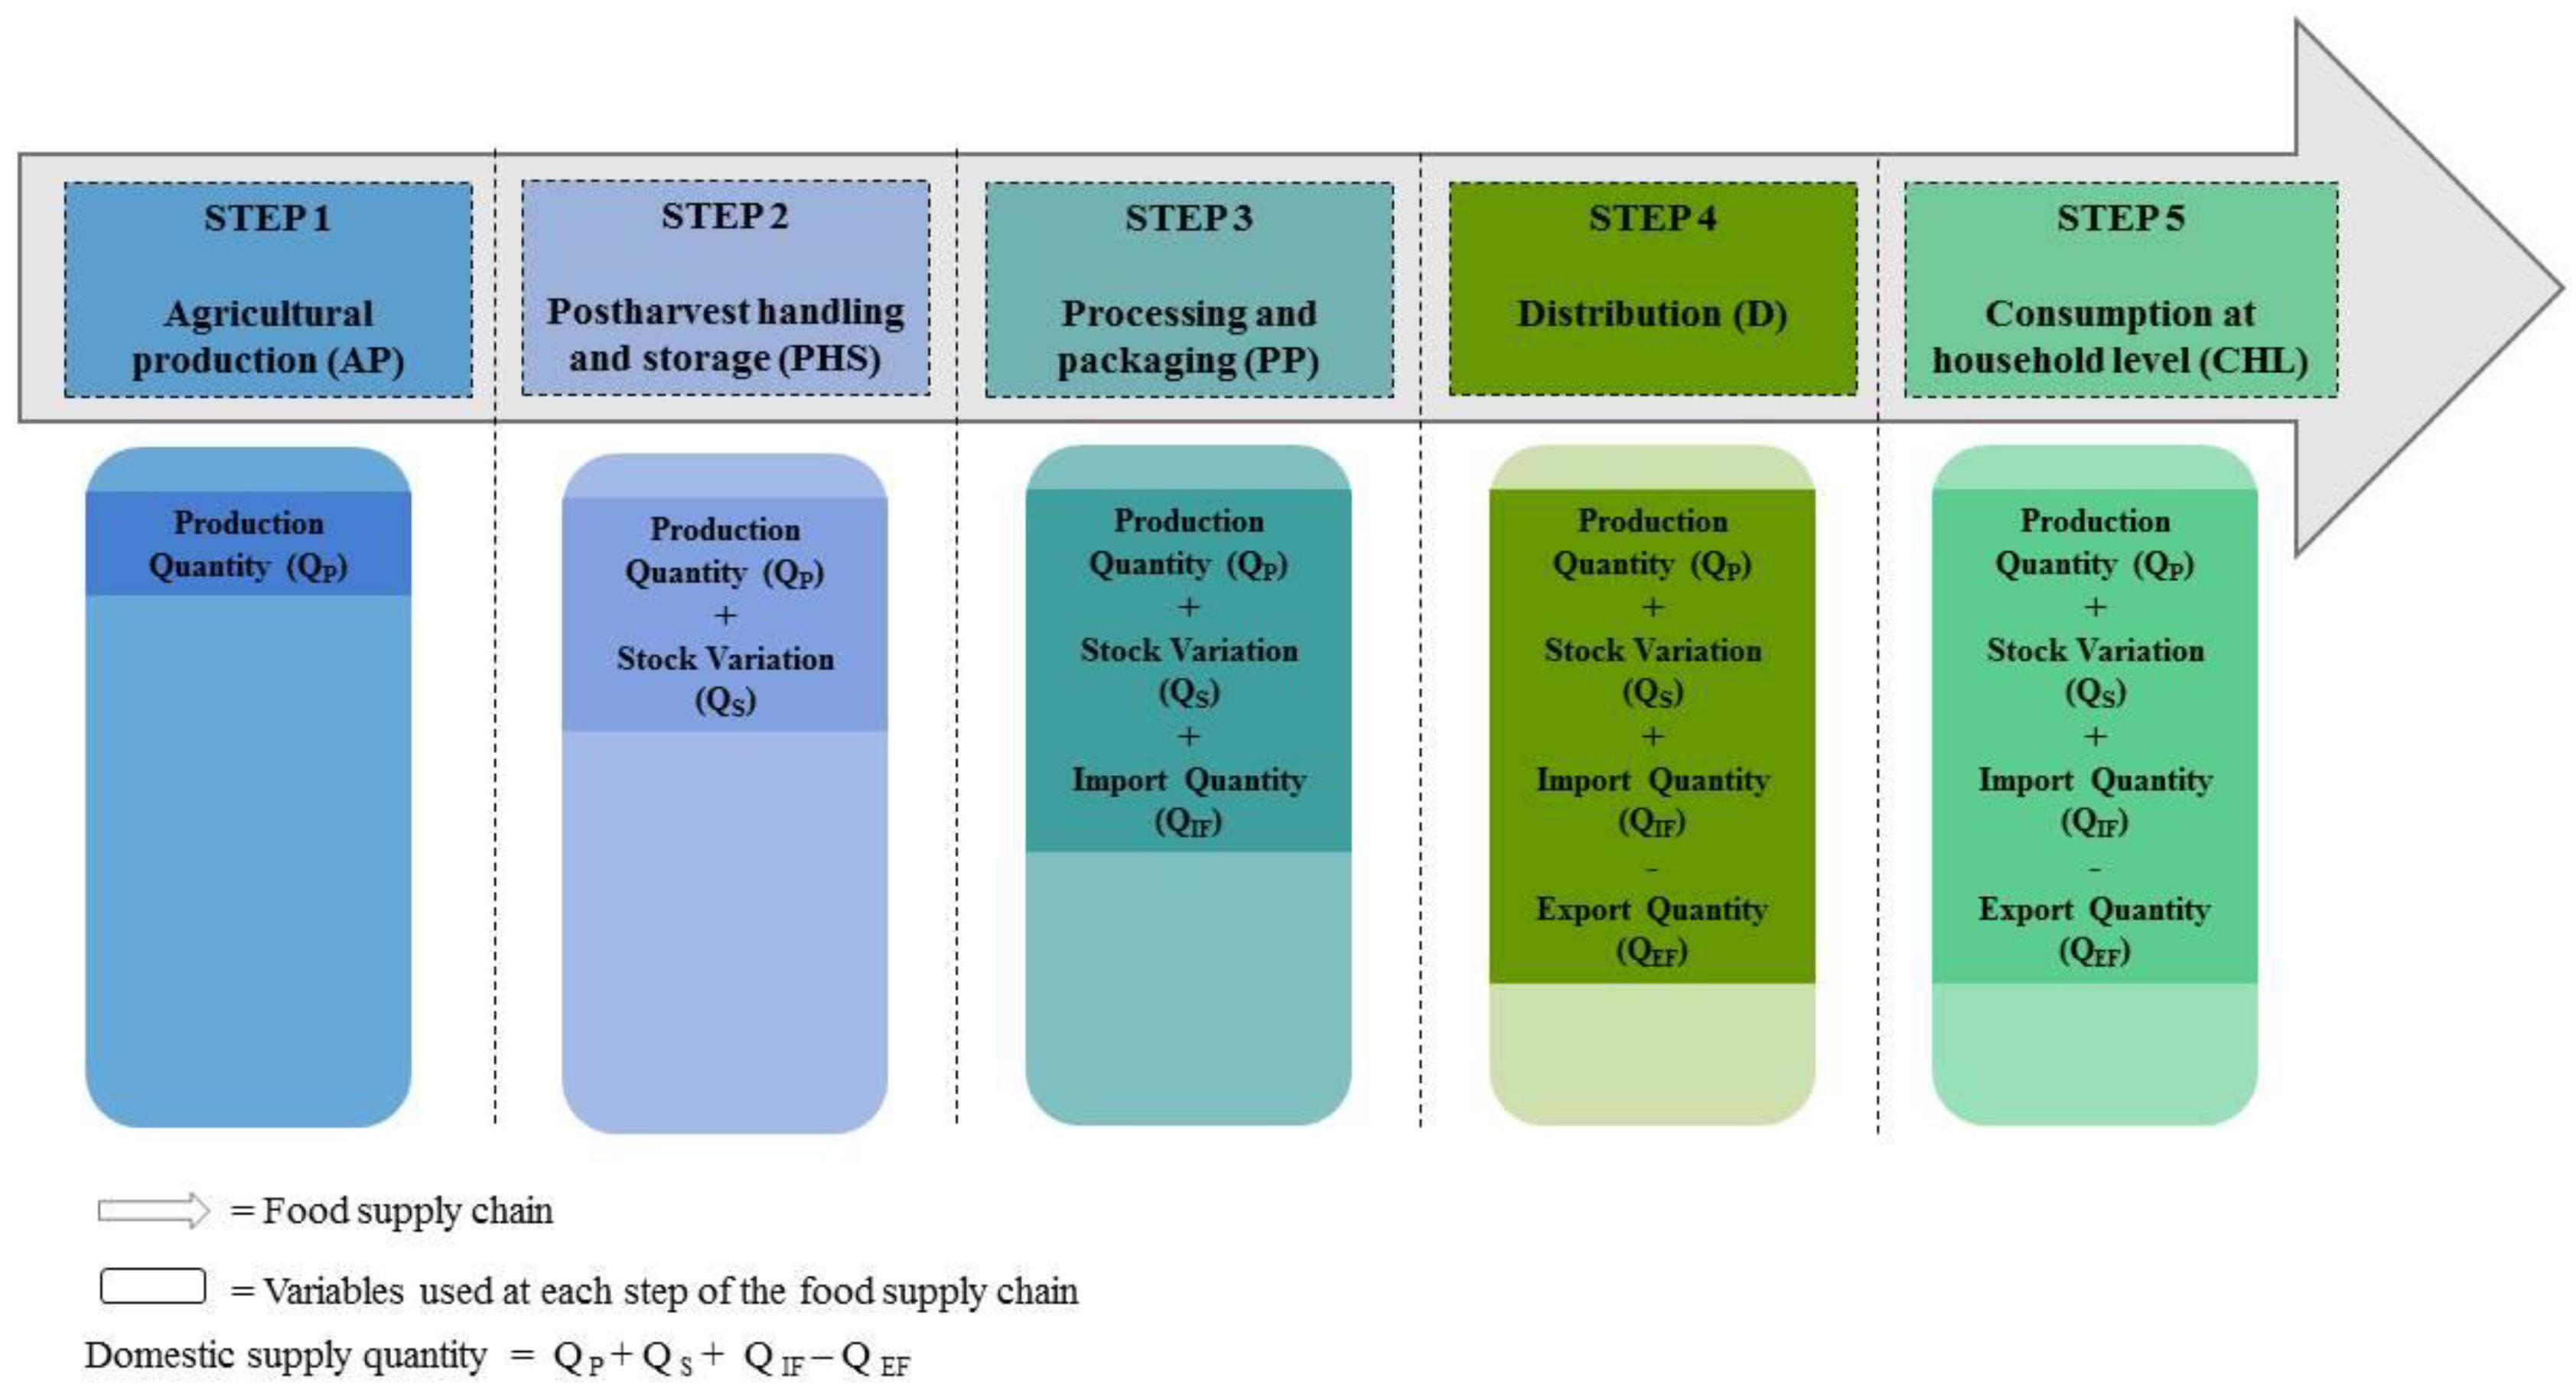
Figure 1 shows the variables used to calculate the amounts of mass in each step of the FSC, from agricultural production to consumption.
The agricultural production step is represented by the quantity of food production, which is summed up to the quantity of food in stock at the post-harvest handling and storage step. The import quantity is inserted at the processing and packaging step because part of the imported foods enters the processing step. The domestic supply of food in Peru is represented by the distribution and consumption at household level steps. For this reason, the export quantity variable was excluded from the count. The data representing the domestic supply of food from 2007 to 2017 by CG in Peru are presented in Supplementary Table S3. The average quantities over this period were also considered in the analysis.
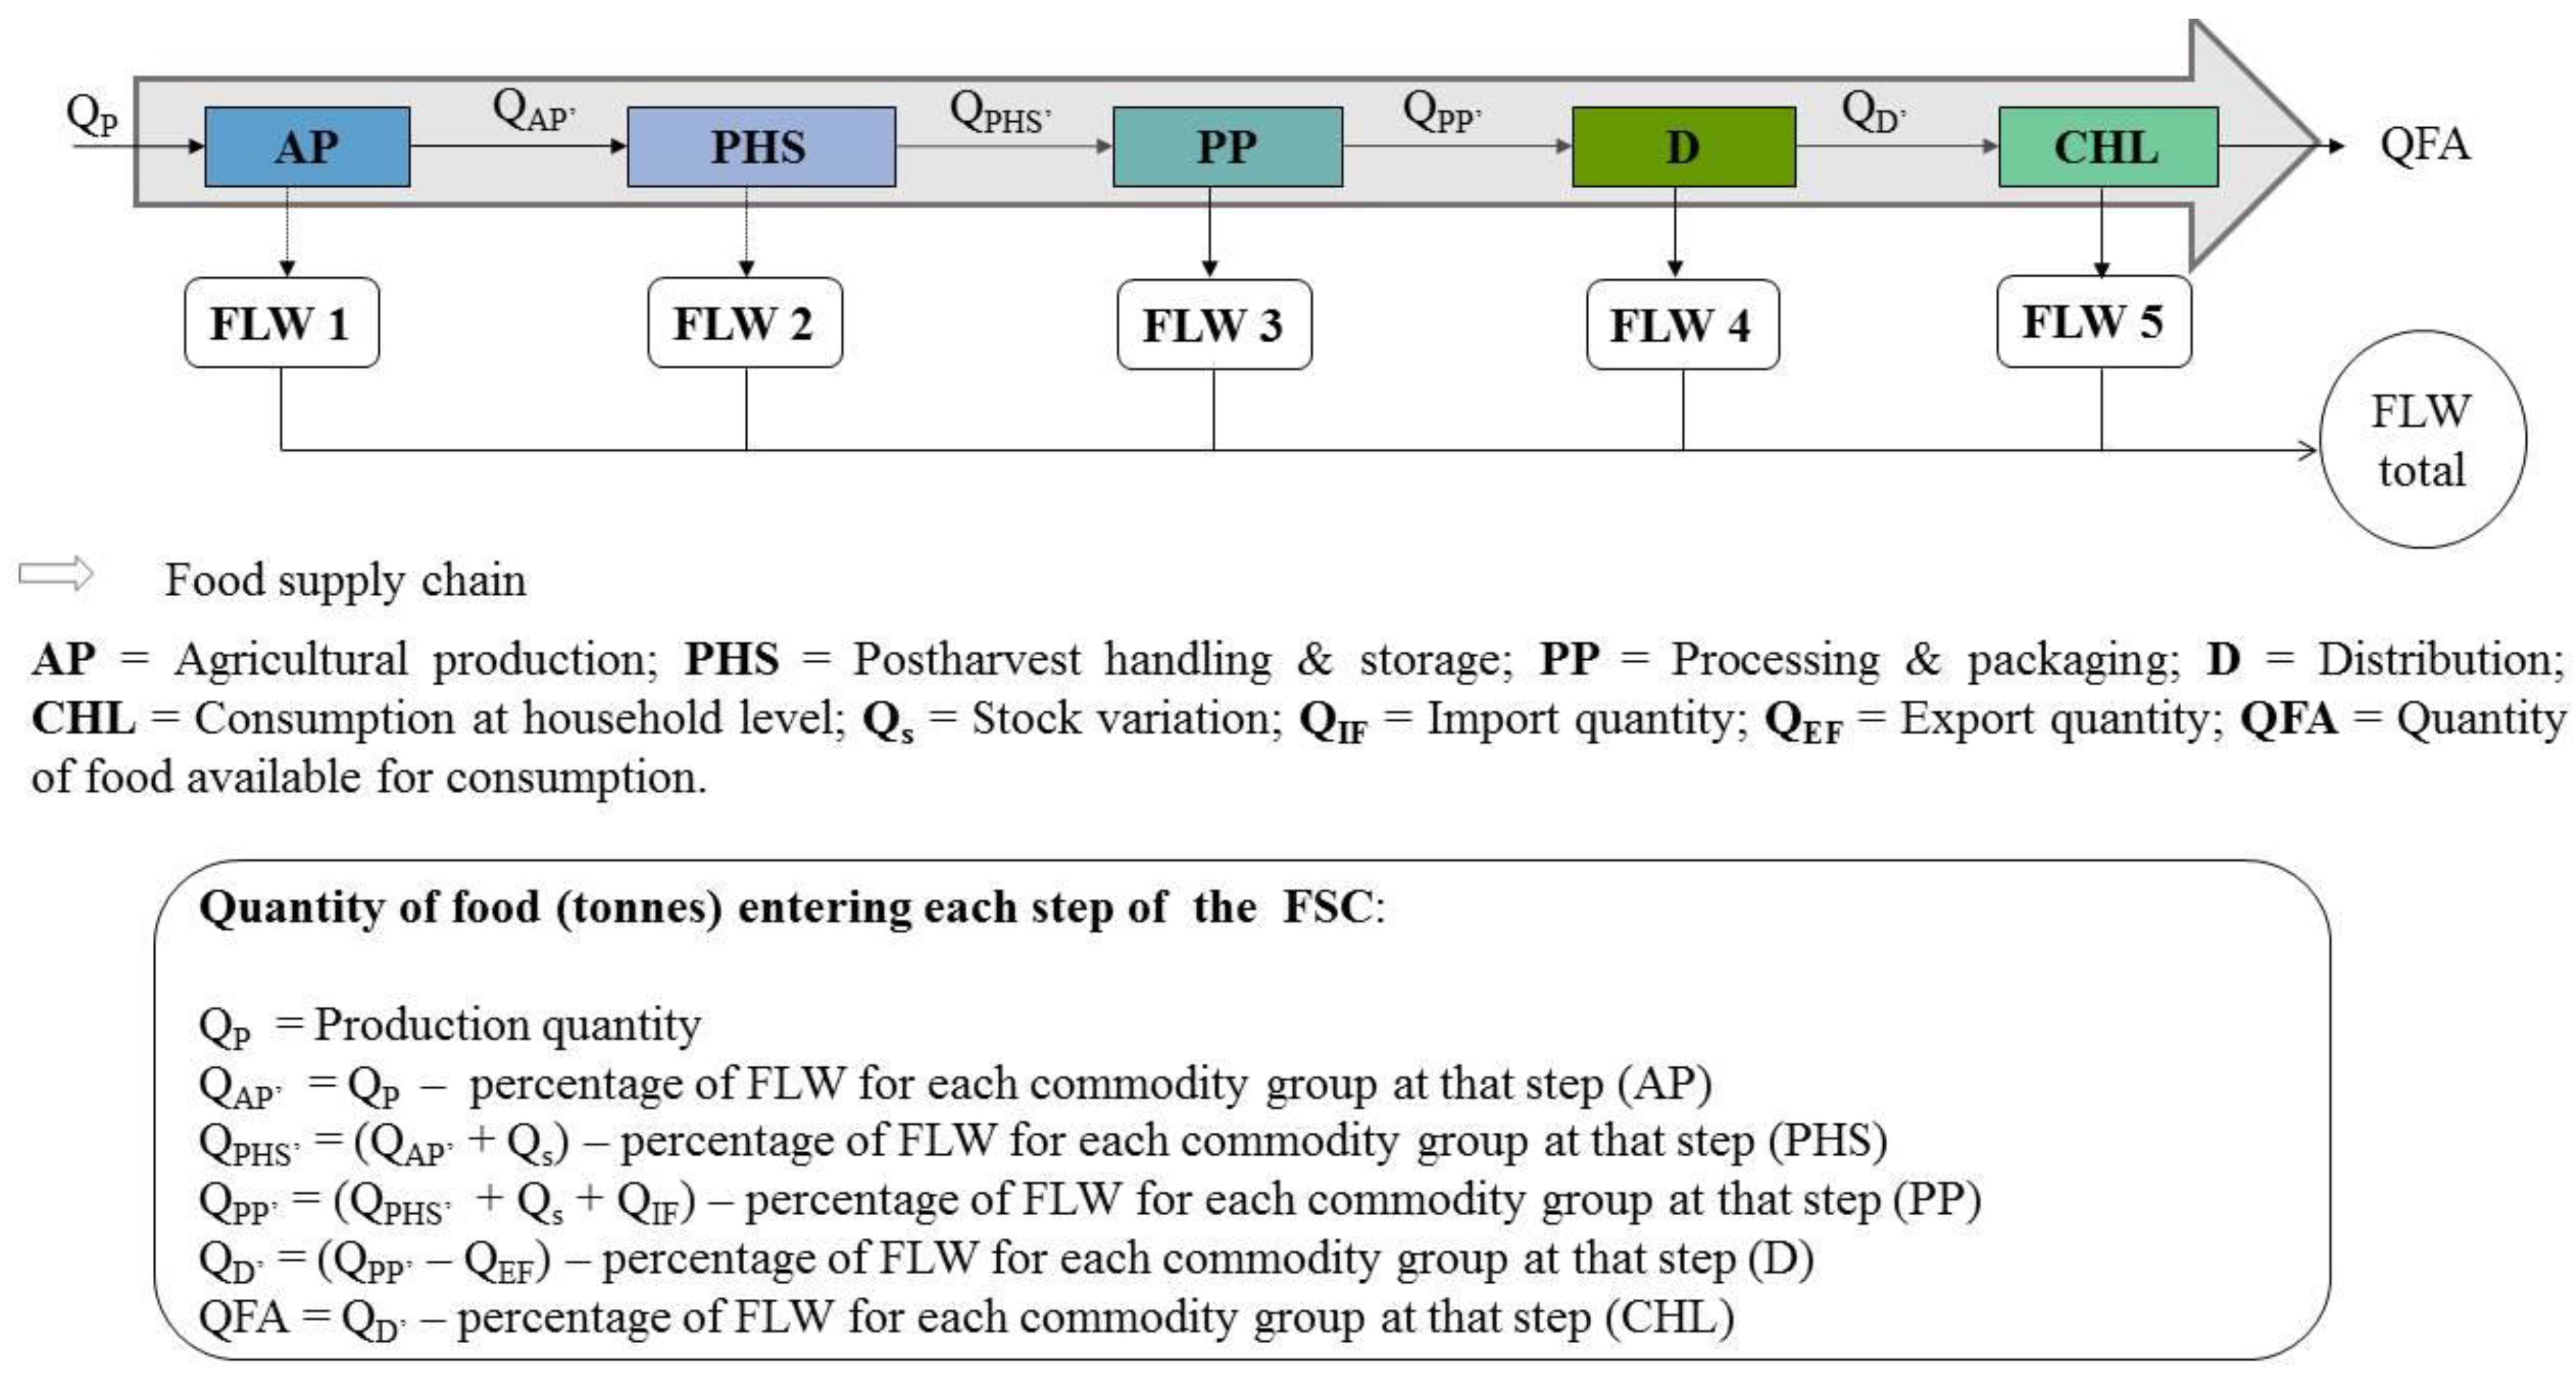
With these variables, the FLW was quantified at each step of the FSC, as shown in Figure 2.
The percentages of FLW per mass of food that enter each step of the FSC, by CG, are given in Supplementary Table S4. These correspond to the coefficients of FLW for Latin American countries, following Gustavsson et al. estimates [13]. The same percentages were considered for all analyzed years. Thus, the FLW calculated at each step of the FSC was subtracted from the previous step’s accumulated food quantity. After quantifying FLW for each step of the FSC, the conversion factors were applied to determine the edible mass. The waste percentages and the conversion factors calculated by Gustavsson et al. [13] have also been used in other studies on FLW (see Oelofse and Nahman [31]; Adelodun and Choi [33]; Reutter et al. [36]).
3. Results and Discussion
3.1. How Much Food Is Lost and Wasted in Peru, and How Is It Distributed in FSC?
The detailed quantity of FLW per year at each step of the Peruvian FSC is presented in Supplementary Table S4. Table 1 summarizes key results for the period analyzed.
The total amount of FLW across the entire FSC was 10.7 million tonnes during 2007 (Table 1a) and 14.4 million tonnes during 2017 (Table 1b). Similarly, the average amount of FLW in the 2007–2017 period was 12.8 million tonnes per year, and the largest was generated during the pre-consumption steps (10.8 million tonnes per year or 84.21%) (Table 1c). This quantity accounted for 47.76% of the average value of the domestic food supply (26,755,000 tonnes).
The Food Bank of Peru (Banco de Alimentos Perú) considers that 9 million tonnes of food are wasted per year [37]. However, it is unknown whether food losses are considered in the count and the accounting methodology applied. Similarly, results are hard to compare since other scientific studies in Latin America focus only on specific steps of the FSC. Only the Dal’ Magro and Talamini [21] study reported that the quantity of FLW in the entire Brazilian FSC reached 82.12 million tonnes per year during 2007–2013. This equates to 42% of its domestic food supply’s average value.
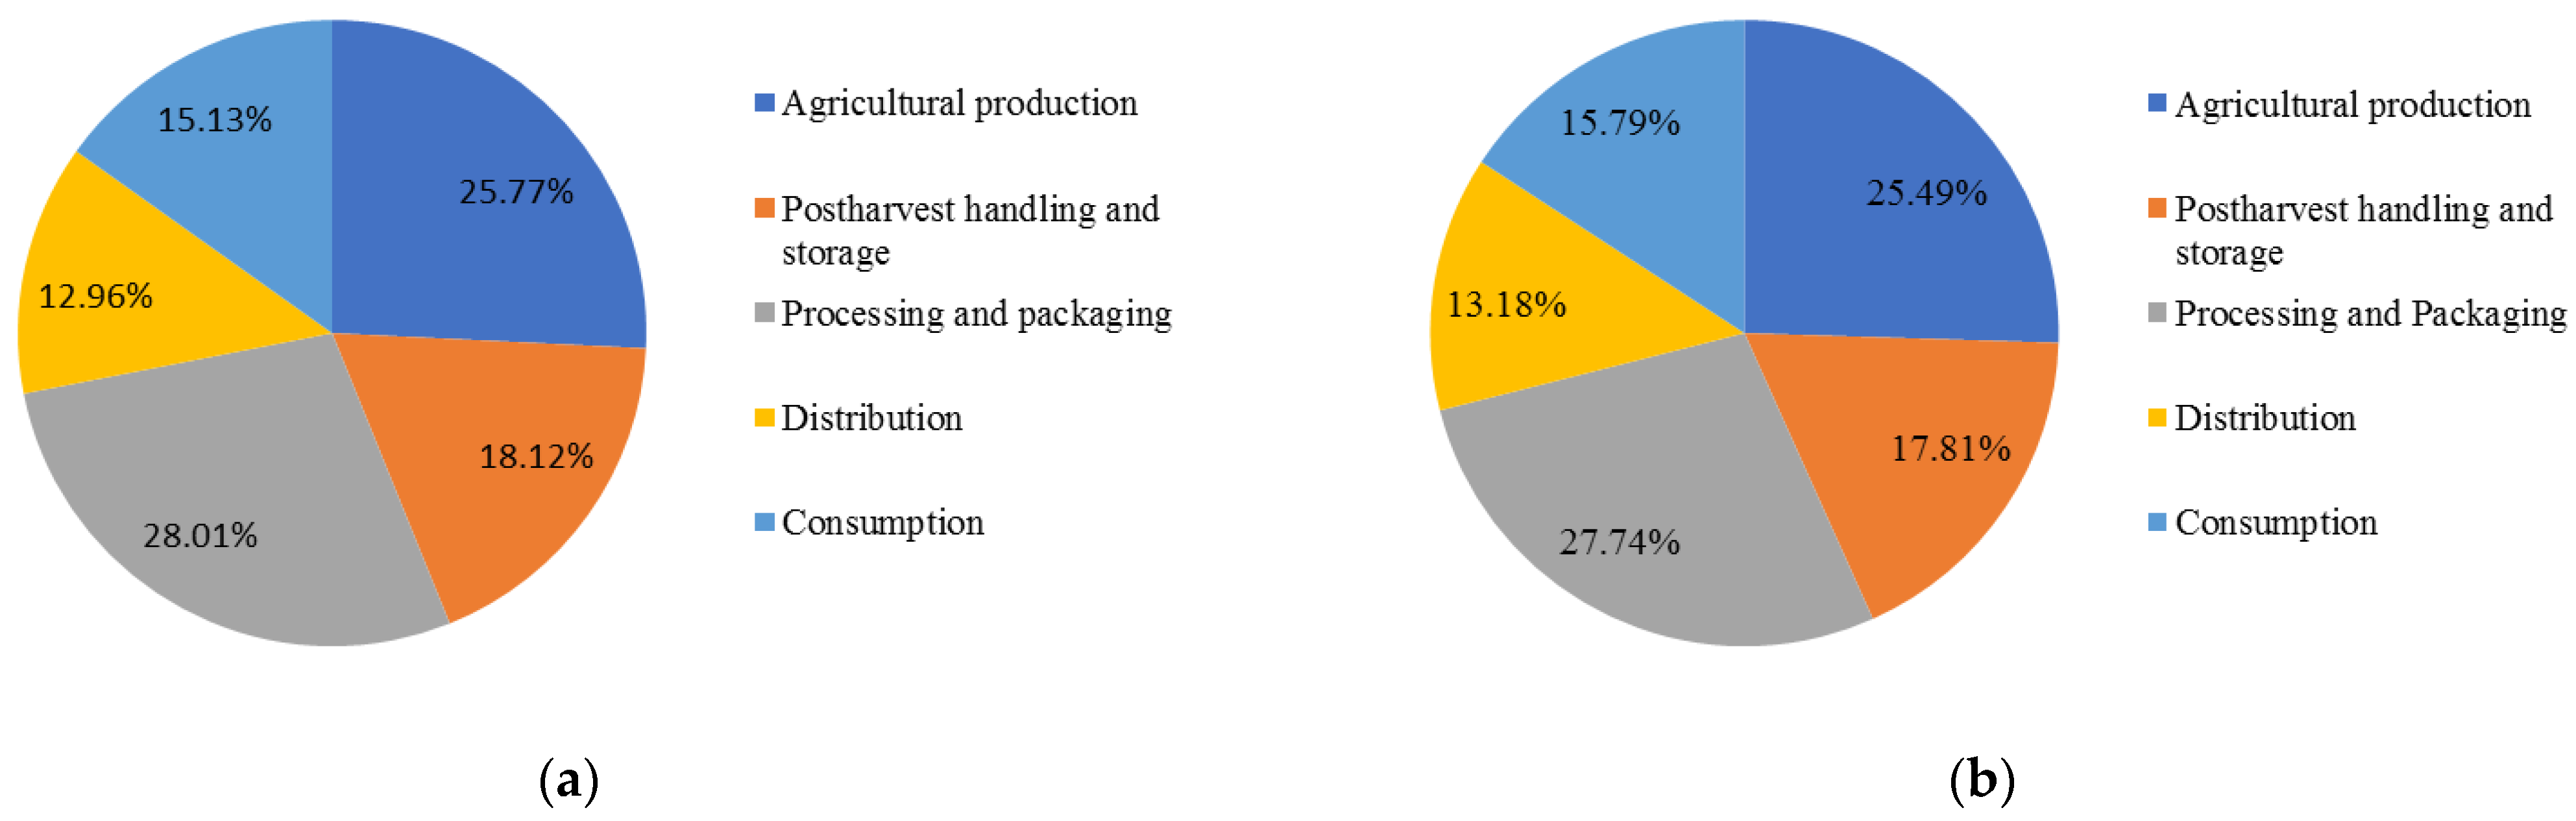
During the period 2007–2017, the total amount of FLW generated in Peru was 3.3 million tonnes in agricultural production, 2.3 million tonnes in post-harvest handling and storage, 3.5 million tonnes in processing and packaging, 1.7 million tonnes in distribution, and 2 million tonnes in consumption. Figure 3a,b illustrates that in 2007 and 2007–2017, approximately 53% of total FLW corresponds to the agricultural production (25%) and processing and packaging (28%) steps.
These findings are similar to those reported in previous studies from upper-middle-income countries, such as South Africa [31] and Brazil [21]. In both countries, the largest FLW estimate also occurred in the agricultural production and processing and packaging steps. It was estimated at 26% and 27% for South Africa, respectively (during 2007). The Brazilian case was estimated at 26% and 24%, respectively (during the 2007–2013 period).
According to Gustavsson et al. [13], FLW in the so-called developing countries are associated with financial, managerial, and technical limitations in harvesting techniques, storage, and cooling facilities in difficult climatic conditions, infrastructure, packaging, and marketing systems. Various studies conducted in Peru can help to analyze the determinants for food waste in Peru during agricultural production and processing and packaging steps.
They are related to the difficulties faced by farmers during production because of unfavorable climatic conditions, pests, and diseases [14,15]; the market inconsistency and product rejections by agri-food corporations due to quality requirements [29]; the immense diversity of supply channels in formal and informal food chains [24,25]; the lack of cold chain logistics in the agri-food and fisheries sectors [27]. Another determinant is that roads are asymmetrically distributed across regions in Peru, which decreases market access for producers and processors (for a complete discussion, please see Aguirre et al. [28] and Martincus et al. [38]).
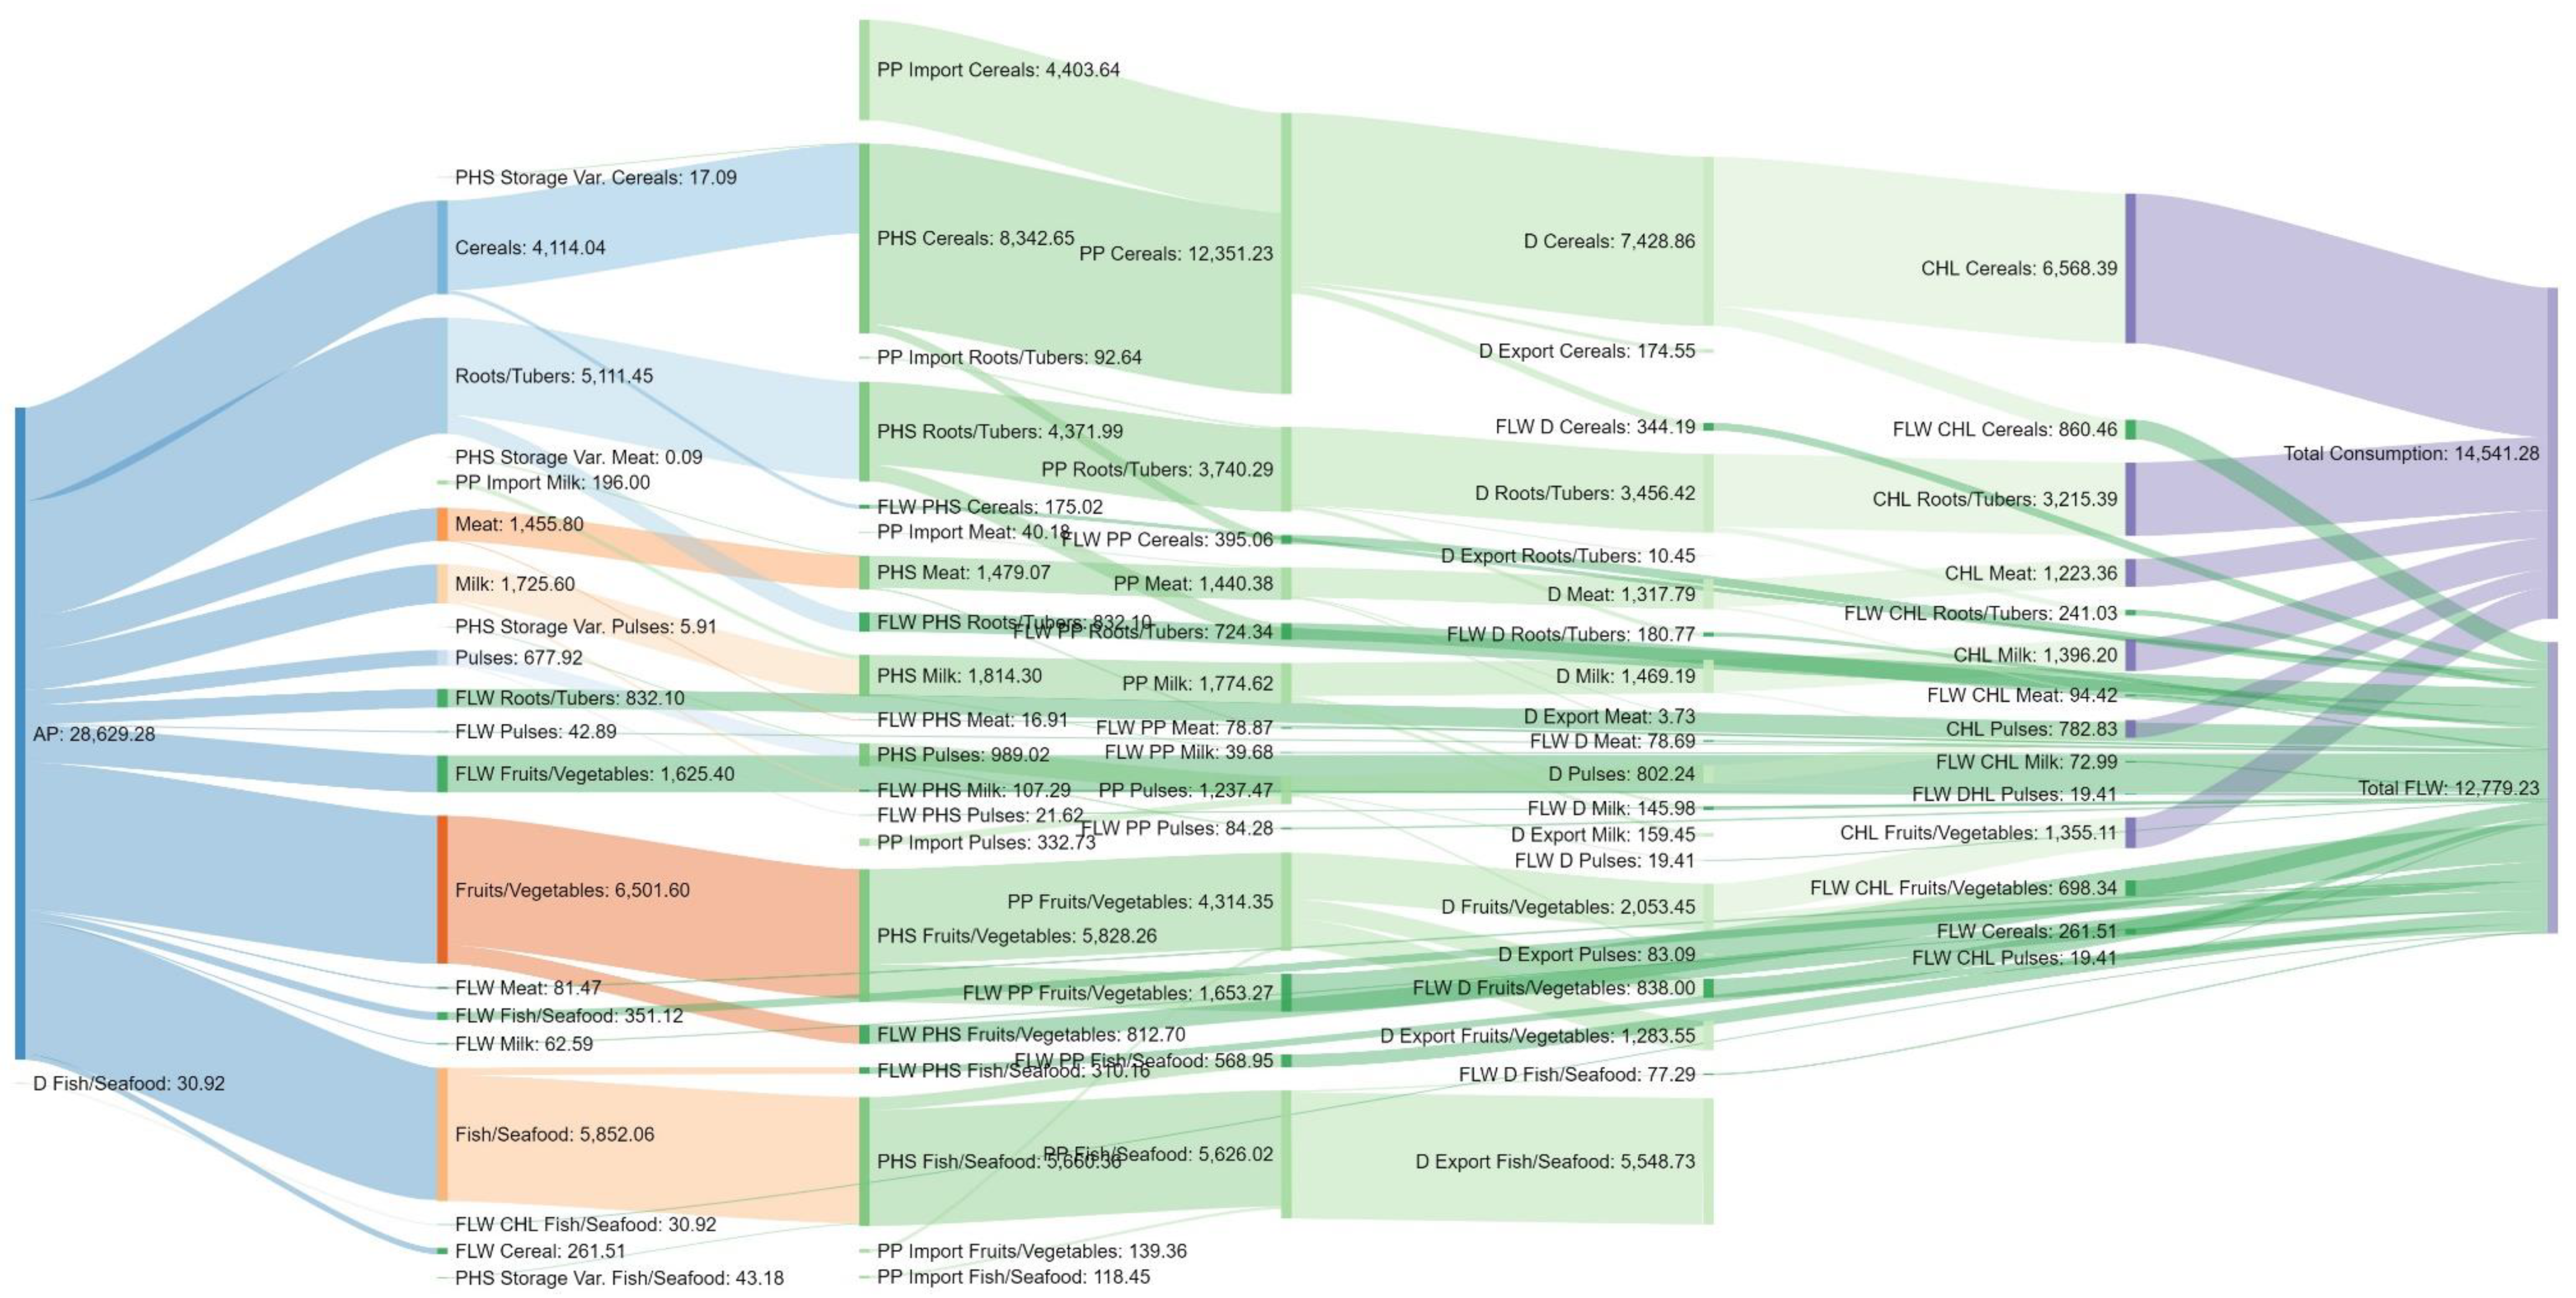
The Peruvian FSC is shown in a Sankey diagram in Figure 4, which demonstrates the mass quantities that comprise each step of the FSC and the FLW quantities calculated for 2007–2017. The Sankey diagram was produced with the online tool SankeyMATIC (http://sankeymatic.com/ (accessed on 3 December 2020)).
3.2. What Food Groups Are Lost and Wasted Most in Peru?
The detailed quantity of FLW per year of every CG is presented in the Supplementary Table S4, and Table 1 summarizes key results for the period analyzed.
In general, it is observed that different dynamics dominate the FSC. In the first stages, in agricultural production and post-harvest handling and storage, the larger quantities of FLW comprise fruits and vegetables and roots and tubers. As for the group of fish and seafood, these groups are the most wasted in the processing and packaging step. Later in the supply chain, which is closer to the customer, in distribution and consumption steps, the quantities of FLW are mainly composed of fruits and vegetables and cereals.
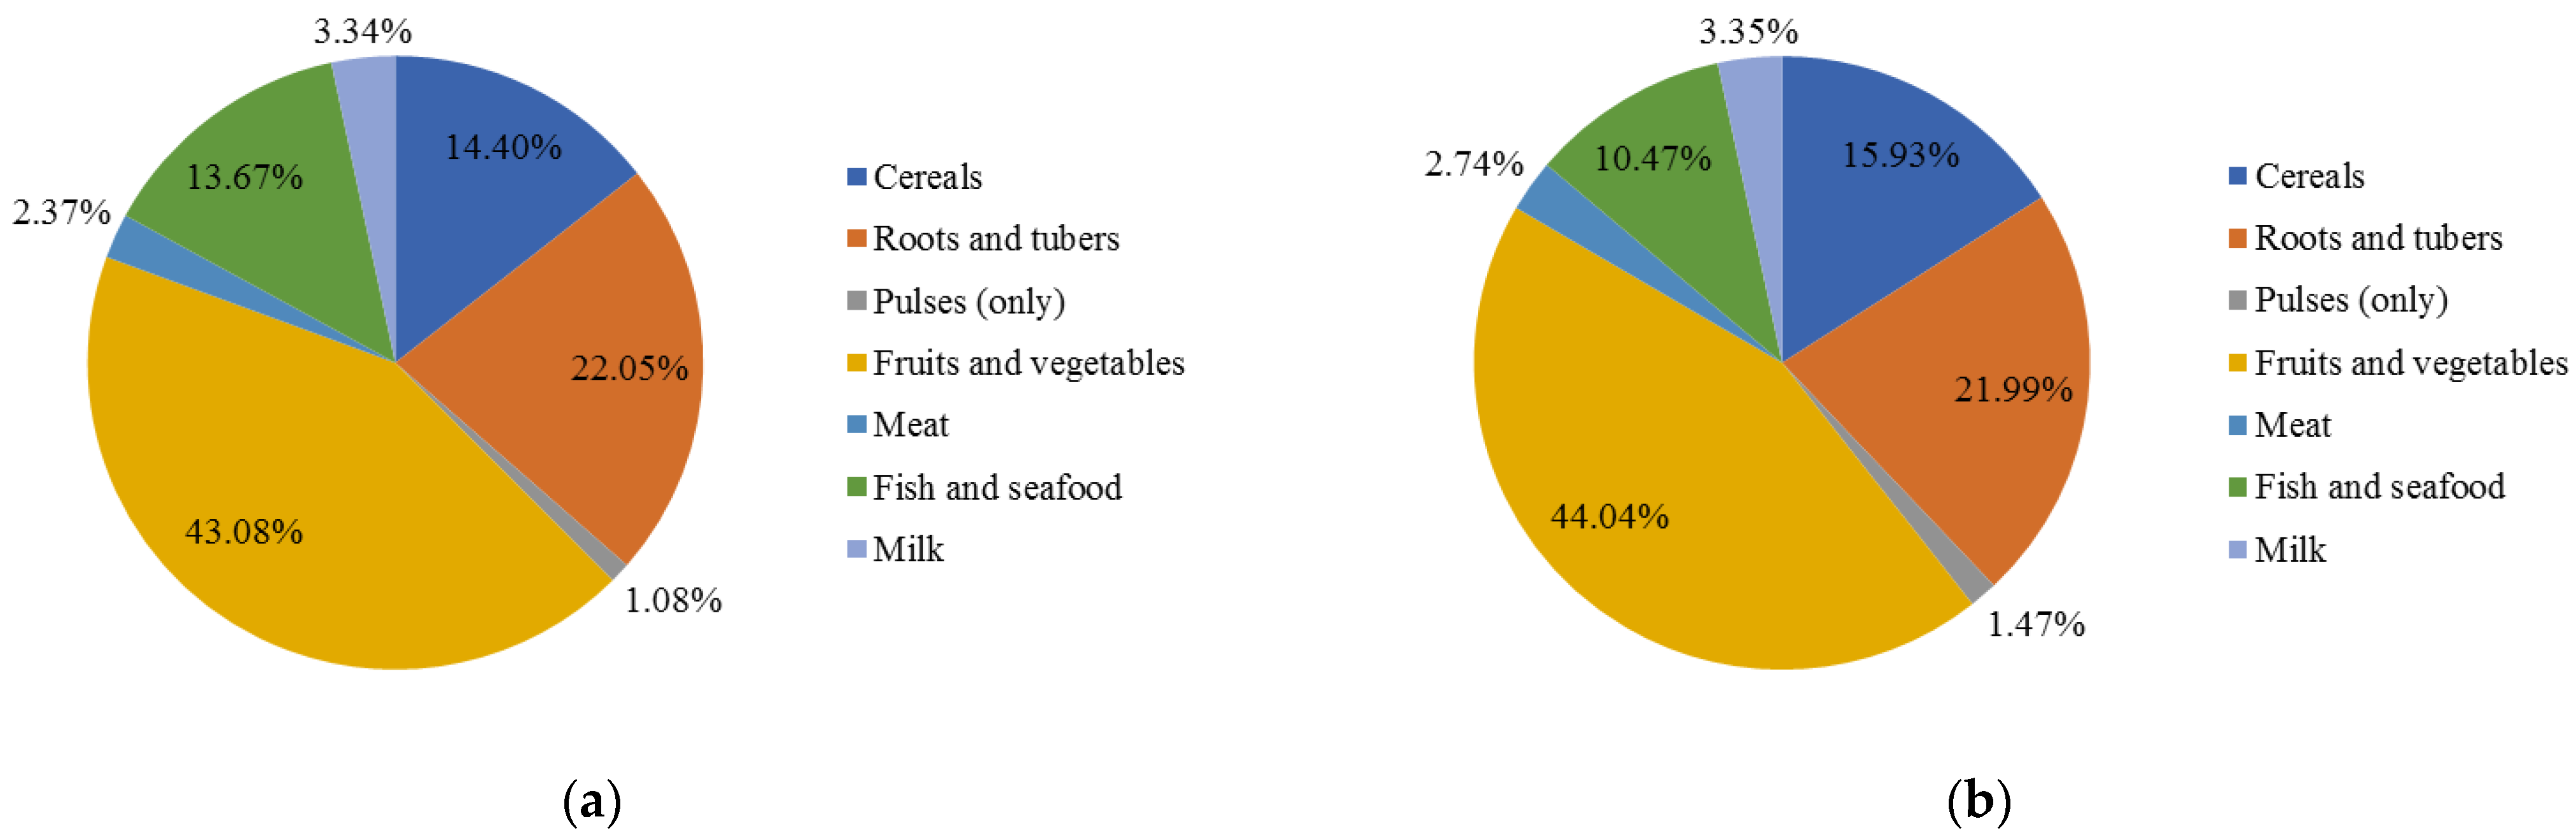
Table 1c shows that FLW of fruits and vegetables represents 44.04% of the total FLW, being that an average of 5.6 million tonnes is generated every year. Figure 5a illustrates the contribution of each CG to total FLW in Peru for the year 2007. The group of fruits and vegetables, with roots and tubers, contributed 65.13% of the total FLW flow. The groups of cereals and fish totaled 28.07%, and the group of pulses, meat, and milk represented 6.8% of FLW in the FSC. The same analysis for the period 2007–2017 is illustrated in Figure 5b. It is also highlighted that the groups of fruits and vegetables, together with roots and tubers, accounted for 66.03% of the FLW flow. In comparison, the groups of cereals and fish accounted for 26.41%, and the groups of pulses, meat, and milk accounted for 7.56%.
These results highlight the most wasted food groups; at the same time, Peru faces nutritional problems. In Peru, only 1 out of 20 individuals consumes the recommended amount of fruits and vegetables per day [39]. Kovalskys et al. [12] also reported that the mean consumption of fruits, vegetables, grains, and fish in Peru is 117.8 g/day, 88.3 g/day, 14.7 g/day, and 28.9 g/day, respectively. However, considering the literature, these amounts are below the minimum requirement evidenced to decrease chronic diseases’ relative risk (200 g/day of fruits and fish and seafood, 300 g/day of vegetables, 100 g/day of grains and beans).
The potato is probably the most lost or wasted tuber because it is one of Peru’s main crops [40]. The studies conducted by Delgado et al. [14] and Velasco et al. [15] provide valuable information about food losses on the potato value chain in Peru. Through surveys among producers, intermediaries, and wholesalers, they found that the largest percentage of losses take place at the production step and that the main reasons for losses are the following: diseases, pest, rain, freeze (pre-harvest loss), bad harvest technique, and lack of costly labor (for product left in the field), laborer damages at harvest, transport and laborer damages at selection (post-harvest loss). Likewise, Tobin and Glenna [29] reported that farmers in the Peruvian highlands commonly confront difficult conditions to harvest good quality potatoes (such as hail and frost). Consequently, the products are subject to rejections.
Although the primary source of animal protein for the Peruvian population is chicken meat [41], government campaigns, such as the program “A Comer Pescado” (let us eat fish), had a positive effect on the propensity to consume fish, which brings nutritional and health benefits [42]. According to Loaiza et al. [43], species from the northern region exhibit the highest long-chain polyunsaturated fatty acids concentrations necessary for a healthy diet, followed by those from the center and southern regions. However, the FLW of fish and seafood can be associated with the lack of cold chain logistics in the Peruvian fisheries and freshwater aquaculture, reported by Avadi and Freon [26] and Freon et al. [27].
The less FLW of the milk group can be associated with the diversity of supply channels in formal and informal markets. It has been demonstrated that informal food chains show better profits per liter of milk than formal ones. Consequently, it allows smallholder farmers in the Peruvian Andes to be involved in the dairy sector [24].
3.3. How Much FLW Is Generated at the Consumer Level, and What Is the Per Capita Amount of FLW in Peru?
The detailed quantity of FLW per year generated in the consumption step is presented in the Supplementary Table S4, and Table 1 summarizes key results for the period analyzed.
Table 1c shows that, on average, two million tonnes of FLW per year were generated in the consumption step during the period analyzed. This amount equals 15.79% of the total FLW throughout the entire FSC (Figure 3b) and represents 7.54% of the average domestic food supply. The CGs that contributed the most considerable amounts to the FLW were cereals (42.65%) and fruits and vegetables (34.61%).
A higher percentage (equal to 18%) was found by Dal’ Magro and Talamini [21] on the consumption step in the Brazilian FSC during the 2007–2013 period. The difference can be associated with food purchase patterns in Peru. It has been reported that households frequently buy smaller quantities of food [44], which is related to the fact that 72% of employment is generated informally across Peru [45].
Table 2 shows that the per capita amount of food waste by consumers in Peru was 57.41 kg in 2007 and 85.49 kg in 2017. On average, 67.34 kg of food was generated annually during the period analyzed.
Gustavsson et al. [13] estimated for the year 2007 that the per capita food waste by consumers in Latin America reaches a value of 25 kg/year, while this rises to 95–115 kg/year in Europe and North America. The authors also reported that the sum of food loss and food waste in Latin America rises to 225 kg/inhabitant.
Table 2 also shows that much more FLW was reported in the Peruvian case, which indicates an amount equal to 379.41 kg/inhabitant during 2007, and 426.56 kg per inhabitant/year during the period analyzed (that being 326.08 kg corresponding to the edible portion of food). Therefore, it is suggested that Peru is probably among the Latin American countries with the highest level of FLW. This may be explained by the fact that Peru is the fifth-largest country by population in Latin America and is considered an upper-middle-income country, where the food industry accounts for almost 22% of the industrial GDP [46]. Thus, trading standards, aesthetic requirements and regulations on food safety in the production, handling, and distribution of foods can cause significant amounts of FLW, as Koester et al. [7] discussed.
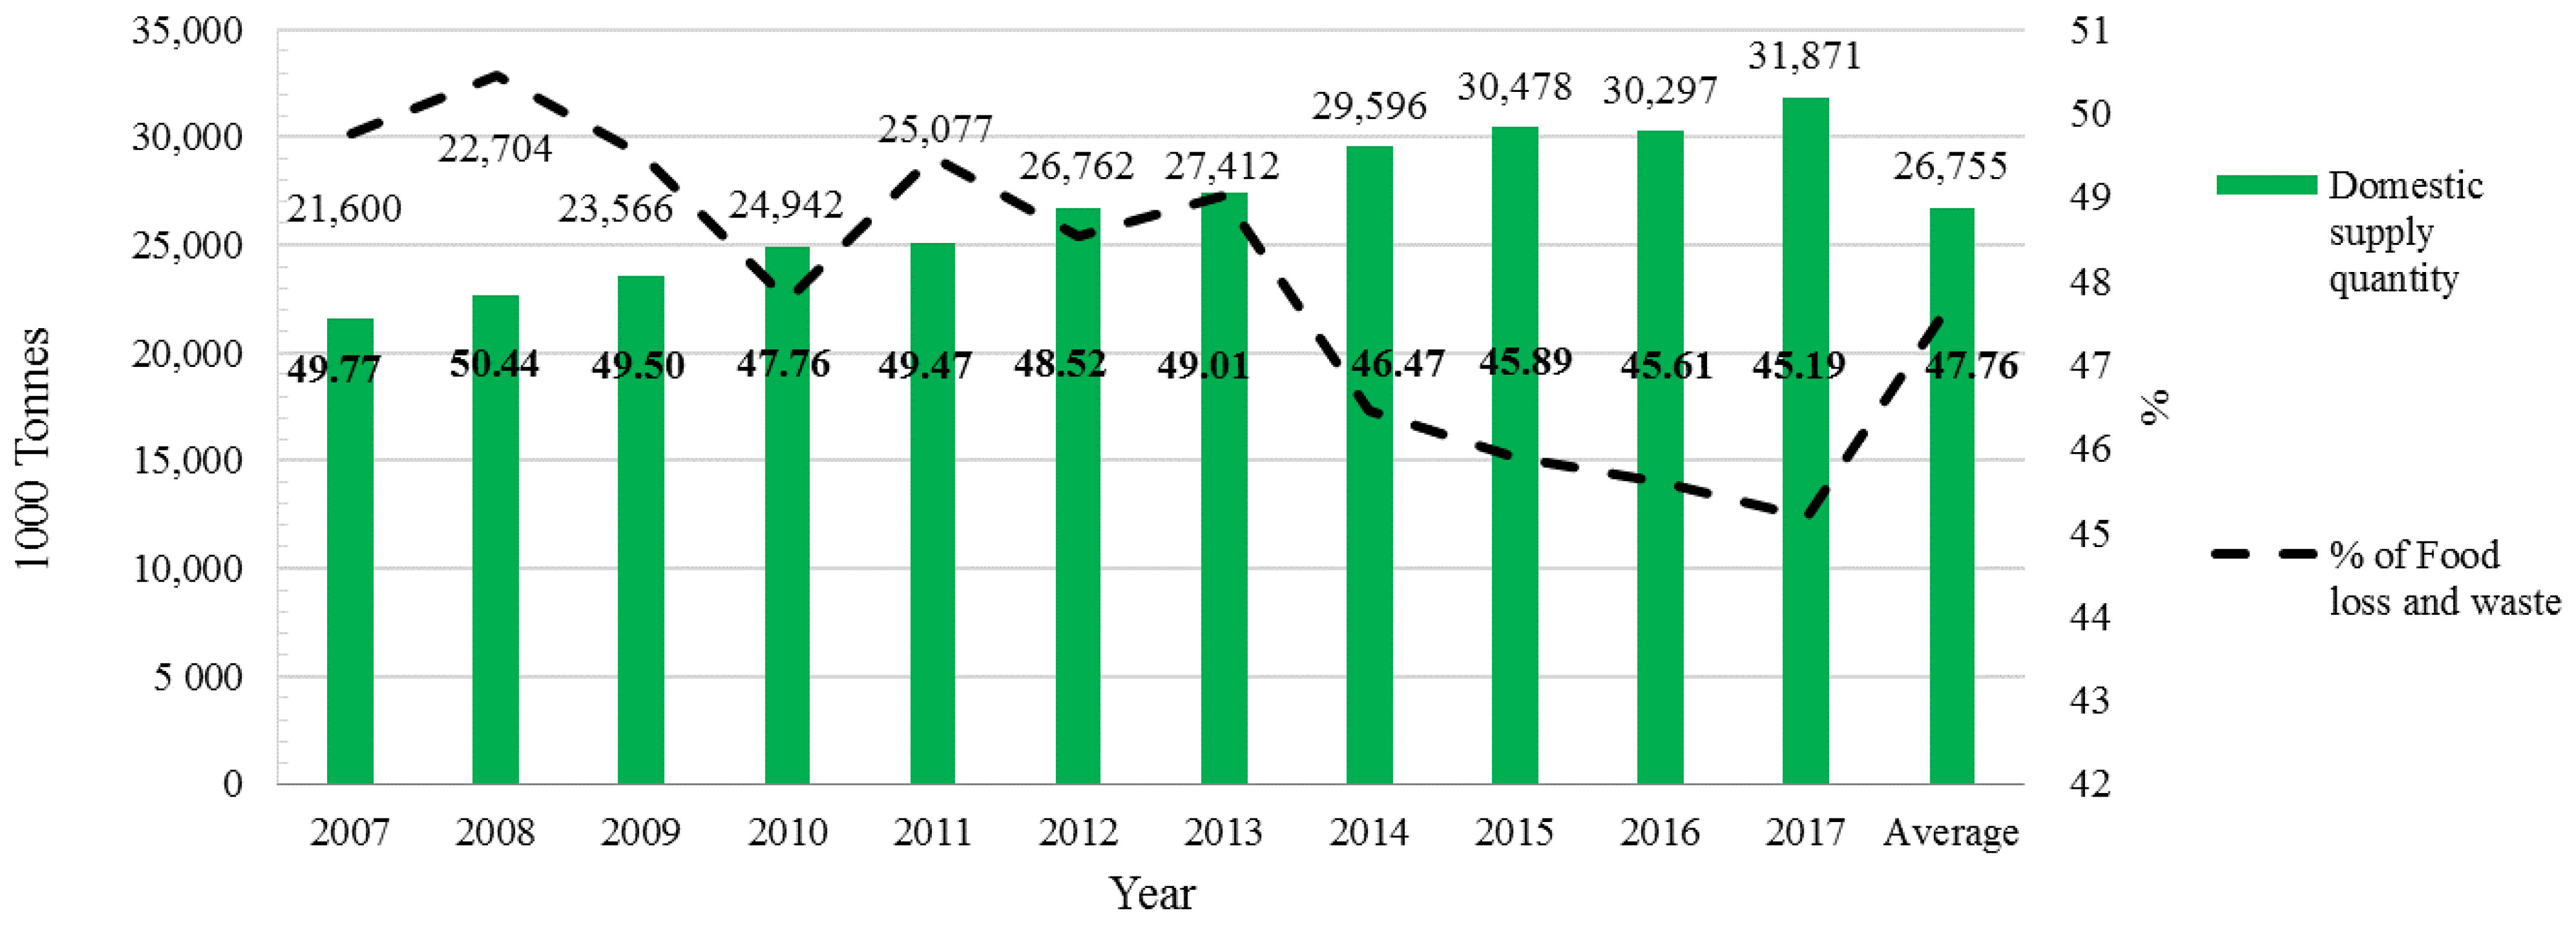
Finally, Figure 6 summarizes the quantities of FLW concerning the domestic food supply in Peru from 2007 to 2017.
3.4. Limitations and Insights for Future Studies
The authors recognize this research depends mostly on the available official data, and the limitation lies precisely like data aggregation. Therefore, this limits a more in-depth analysis, such as determining FLW per food crop instead of grouping them. Besides, the estimates of FLW calculated by Gustavsson et al. [13] referring to Latin America were considered to calculate FLW in Peru, but they might vary depending on the country. For this reason, a central goal of future research should be to calculate proportions of FLW at each step of the FSC, specifically for Peru. Given these limitations, this study provides a preliminary evaluation of the food waste generation in Peruvian FSC.
When considering the FSC analysis, as in the present study, it becomes evident that the determinants of food waste generation result from interconnected and diversified causes. Therefore, there is still much analysis to identify them in Peru’s various food chains. The findings presented here provide the first step toward a better understanding of the magnitude of food waste in Peru. The results can help scientists and policy makers work on food waste policy and food waste management, considering that the food chain actors, including farmers, food manufacturers, processors, retailers, and consumers, have a role to play in food waste prevention and reduction.
A vast amount of literature aims to reduce FLW, which could be used for developing strategies [47,48]. For instance, they are related to innovation in short food supply chains [49] and short marketing circuits [50], valorization of food manufacturing waste [51], intelligent food logistics [52] and supply chain planning [53]. Strategies to mitigate FLW also need to consider the marketing infrastructure for farmers to easily reach buyers to sell their surplus produce. Aguirre et al. [28] studied the impact of rural road connectivity on farming activities and trade in Peru, and found that “for those districts in which producer travel time from home to the district capital is less than 24 h, the farmer’s travel time reduces by up to 3.1 h if the average road density district is increased by 1 km/km2”.
Peru is the world leader in various crops and is becoming an essential player in the global food market. Therefore, the impact of trading standards, aesthetic requirements and food safety regulations needs to be studied. Future studies also could focus on the land and water footprints associated with food losses as done for other countries, such as Brazil [54], Korea [33], and India [55]. This research line could focus on Peru’s export-oriented supply chains considering, for instance, the Andean crops associated with rapid land-use change [56] or horticultural export chains [57]. Finally, studying the differences in FLW generation between Peruvian regions could help support local food security strategies.
4. Conclusions
The current study shows how much food is lost and wasted along the FSC in Peru. Data from 2007 to 2017 were analyzed, and the results show that, on average, Peru generates 12.8 million tonnes of FLW per year. This amount represents 47.76% of the national food supply. On a per-capita basis, when considering the entire FSC, the quantity of FLW is 426.56 kg per inhabitant/year (326.08 kg corresponding to the edible portion of food). Nevertheless, when considering only the consumption step, the quantity of FLW is 67.34 Kg per inhabitant/year. Accordingly, the results suggest that in Latin America, Peru is probably among the countries with the highest level of FLW because Gustavsson et al. [13] have estimated that the per capita food waste by consumers in Latin America reaches a value of 25 kg/year, and the sum of food loss and food waste rises to 225 kg/inhabitant.
This study highlights which steps of the FSC and CGs are the most promising targets for FLW reduction strategies in Peru. Thus, the agricultural production and processing and packaging steps represent 53% of the average amount of FLW in the FSC. At the same time, fruits and vegetables and roots and tubers groups are responsible for the highest amount of FLW. These food groups account for 44% and 22% of the total, respectively. At the consumption step, the food groups presenting the highest amount of FLW are cereals (43%), fruits and vegetables (35%) and roots and tubers (12%).
This research has limitations that have been pointed out. Therefore, this paper provides a preliminary evaluation of the food waste generation in Peru and guidance to researchers seeking to collect primary data on FLW or to ensure robust support for decision making about FLW reduction. This paper also contributes to promoting knowledge of FLW in Latin America.
Supplementary Materials
The following are available online at https://www.mdpi.com/2071-1050/13/5/2807/s1, Table S1: Peruvian food balance data by commodity group (2007–2017), Table S2: Food crop products included in the analysis, Table S3: Quantity of food to calculate loss and waste in each step of the Peruvian food supply chain (2007–2017), Table S4: Quantity of food loss and waste per year at each step of the Peruvian food supply chain (2007–2017).
Author Contributions
Conceptualization and investigation, N.S.B.-P. and G.P.D.M.; methodology, G.P.D.M.; data curation and validation, N.S.B.-P. and G.P.D.M.; formal analysis, N.S.B.-P.; writing—original draft preparation, N.S.B.-P.; writing—review and editing, N.S.B.-P. and G.P.D.M.; project administration and funding acquisition, N.S.B.-P. All authors have read and agreed to the published version of the manuscript.
Funding
This research was supported by UNIVERSIDAD NACIONAL DE MOQUEGUA, UNAM–VPI through project A2020007.
Institutional Review Board Statement
Not applicable.
Informed Consent Statement
Not applicable.
Data Availability Statement
Data is contained within the Supplementary Material.
Acknowledgments
The authors are grateful to Edson Talamini from Center for Studies and Research in Agribusiness at Federal University of Rio Grande do Sul (Porto Alegre, RS, Brazil) for his kind revision of the manuscript.
Conflicts of Interest
The authors declare no conflict of interest.
References
- Irani, Z.; Sharif, A.M.; Lee, H.B.; Aktas, E.; Topaloglu, Z.; Van’t Wout, T.; Huda, S. Managing food security through food waste and loss: Small data to big data. Comput. Oper. Res. 2018, 98, 367–383. [Google Scholar] [CrossRef]
- Parfitt, J.; Barthel, M.; Macnaughton, S. Food waste within food supply chains: Quantification and potential for change to 2050. Philos. Trans. R. Soc. Lond. B Biol. Sci. 2010, 365, 3065–3081. [Google Scholar] [CrossRef] [PubMed] [Green Version]
- Abbade, E.B. Estimating the nutritional loss and the feeding potential derived from food losses worldwide. World Dev. 2020, 134, 105038. [Google Scholar] [CrossRef]
- Galli, F.; Cavicchi, A.; Brunori, G. Food waste reduction and food poverty alleviation: A system dynamics conceptual model. Agric. Hum. Values 2019, 36, 289–300. [Google Scholar] [CrossRef]
- Chen, C.X.; Chaudhary, A.; Mathys, A. Nutritional and environmental losses embedded in global food waste. Resour. Conserv. Recycl. 2020, 160, 104912. [Google Scholar] [CrossRef]
- Read, Q.D.; Brown, S.; Cuellar, A.D.; Finn, S.M.; Gephart, J.A.; Marston, L.T.; Muth, M.K. Assessing the environmental impacts of halving food loss and waste along the food supply chain. Sci. Total Environ. 2020, 712, 136255. [Google Scholar] [CrossRef] [PubMed]
- Koester, U.; Loy, J.P.; Ren, Y.J. Food Loss and Waste: Some Guidance. EuroChoices 2020, 19, 17–21. [Google Scholar] [CrossRef]
- Xue, L.; Liu, G.; Parfitt, J.; Liu, X.J.; Van Herpen, E.; Stenmarck, A.; Cheng, S. Missing Food, Missing Data? A Critical Review of Global Food Losses and Food Waste Data. Environ. Sci. Technol. 2017, 51, 6618–6633. [Google Scholar] [CrossRef] [PubMed]
- Skoet, J.; Fabi, C.; Cattaneo, A. Measuring Food Loss and Waste: An FAO Perspective. EuroChoices 2020, 19, 22–23. [Google Scholar] [CrossRef]
- FAO—Food and Agriculture Organization of the United Nations. The State of Food and Agriculture 2019. Moving forward on Food Loss and Waste Reduction; FAO: Rome, Italy, 2019; Available online: https://www.fao.org/3/ca6030en/ca6030en.pdf (accessed on 5 September 2020).
- Gomez, G.; Fisberg, R.M.; Previdelli, A.N.; Sales, C.H.; Kovalskys, I.; Fisberg, M.; Grp, E.S. Diet Quality and Diet Diversity in Eight Latin American Countries: Results from the Latin American Study of Nutrition and Health (ELANS). Nutrients 2019, 11, 1605. [Google Scholar] [CrossRef] [PubMed] [Green Version]
- Kovalskys, I.; Rigotti, A.; Koletzko, B.; Fisberg, M.; Gomez, G.; Herrera-Cuenca, M.; Grp, E.S. Latin American consumption of major food groups: Results from the ELANS study. PLoS ONE 2019, 14, e0225101. [Google Scholar] [CrossRef] [Green Version]
- Gustavsson, J.; Cederberg, C.; Sonesson, U. Global Food Losses and Food Waste Extent, Causes and Prevention. SAVE FOOD: An Initiative on Food Loss and Waste Reduction; Food and Agriculture Organization of the United Nations: Rome, Italy, 2011. [Google Scholar]
- Delgado, L.; Schuster, M.; Torero, M. Reality of Food Losses: A New Measurement Methodology. MPRA Paper 80378. 2017. Available online: https://mpra.ub.uni-muenchen.de/80378/ (accessed on 5 September 2020).
- Velasco, C.; Ordinola, M.; Devaux, A. An approach to measuring food losses in the potato chain in Ecuador and Peru. Rev. Latinoam. Papa 2019, 23, 46–65. [Google Scholar] [CrossRef]
- Chaboud, G. Assessing food losses and waste with a methodological framework: Insights from a case study. Resour. Conserv. Recycl. 2017, 125, 188–197. [Google Scholar] [CrossRef]
- Aschemann-Witzel, J.; Gimenez, A.; Ares, G. Household food waste in an emerging country and the reasons why: Consumer’s own accounts and how it differs for target groups. Resour. Conserv. Recycl. 2019, 145, 332–338. [Google Scholar] [CrossRef]
- Lebersorger, S.; Schneider, F. Food loss rates at the food retail, influencing factors and reasons as a basis for waste prevention measures. Waste Manag. 2014, 34, 1911–1919. [Google Scholar] [CrossRef]
- Ellison, B.; Muth, M.K.; Golan, E. Opportunities and Challenges in Conducting Economic Research on Food Loss and Waste. Appl. Econ. Perspect. Policy 2019, 41, 1–19. [Google Scholar] [CrossRef]
- Corrado, S.; Sala, S. Food waste accounting along food supply chains: State of the art and outlook. Waste Manag. 2018, 79, 120–131. [Google Scholar] [CrossRef] [PubMed]
- Dal’ Magro, G.P.; Talamini, E. Estimating the magnitude of the food loss and waste generated in Brazil. Waste Manag. Res. 2019, 37, 706–716. [Google Scholar] [CrossRef]
- United Nations. World Economic Situation and Prospects 2020; United Nations: New York, NY, USA, 2020; Available online: https://www.un.org/development/desa/dpad/wp-content/uploads/sites/45/WESP2020_FullReport.pdf (accessed on 25 November 2020).
- Peru. Ley N° 30988: Ley que Promueve la Reducción y Prevención de Pérdidas y Desperdicios de Alimentos. 2019. Available online: https://busquedas.elperuano.pe/normaslegales/ley-que-promueve-la-reduccion-y-prevencion-de-perdidas-y-des-ley-n-30988-1791312-3/ (accessed on 5 September 2020).
- Navarro, E.F.; Faure, G.; Cortijo, E.; De Nys, E.; Bogue, J.; Gomez, C.; Le Gal, P.Y. The impacts of differentiated markets on the relationship between dairy processors and smallholder farmers in the Peruvian Andes. Agric. Syst. 2015, 132, 145–156. [Google Scholar] [CrossRef]
- Mercado, W. Institutional economy of the quinoa productive chain in Junin, Peru. Sci. Agropecu. 2018, 9, 329–342. [Google Scholar] [CrossRef] [Green Version]
- Avadi, A.; Freon, P. A set of sustainability performance indicators for seafood: Direct human consumption products from Peruvian anchoveta fisheries and freshwater aquaculture. Ecol. Indic. 2015, 48, 518–532. [Google Scholar] [CrossRef]
- Freon, P.; Sueiro, J.C.; Iriarte, F.; Evar, O.F.M.; Landa, Y.; Mittaine, J.F.; Bouchon, M. Harvesting for food versus feed: A review of Peruvian fisheries in a global context. Rev. Fish Biol. Fish. 2014, 24, 381–398. [Google Scholar] [CrossRef]
- Aguirre, J.; Campana, Y.; Guerrero, E.; Ugarte, D. Roads and agriculture: Impacts of connectivity in Peru. Int. J. Transp. Econ. 2018, 45, 605–629. [Google Scholar] [CrossRef]
- Tobin, D.; Glenna, L. Value Chain Development and the Agrarian Question: Actor Perspectives on Native Potato Production in the Highlands of Peru. Rural Sociol. 2019, 84, 541–568. [Google Scholar] [CrossRef]
- Chaboud, G.; Daviron, B. Food losses and waste: Navigating the inconsistencies. Glob. Food Sec. 2017, 12, 1–7. [Google Scholar] [CrossRef]
- Oelofse, S.H.; Nahman, A. Estimating the magnitude of food waste generated in South Africa. Waste Manag. Res. 2013, 31, 80–86. [Google Scholar] [CrossRef] [PubMed]
- Brunner, P.H.; Rechberger, H. Practical Handbook of Material Flow Analysis; Lewis Publishers: Boca Raton, FL, USA, 2004; pp. 1–30. [Google Scholar]
- Adelodun, B.; Choi, K.S. Impact of food wastage on water resources and GHG emissions in Korea: A trend-based prediction modeling study. J. Clean. Prod. 2020, 271, 122562. [Google Scholar] [CrossRef]
- FAOSTAT. New Food Balance Sheets. Food and Agriculture Organization of the United Nations, 2020. Available online: https://www.fao.org/faostat/en/#data/FBS (accessed on 9 November 2020).
- Kummu, M.; de Moel, H.; Porkka, M.; Siebert, S.; Varis, O.; Ward, P.J. Lost food, wasted resources: Global food supply chain losses and their impacts on freshwater, cropland, and fertiliser use. Sci. Total Environ. 2012, 438, 477–489. [Google Scholar] [CrossRef]
- Reutter, B.; Lant, P.A.; Lane, J.L. The challenge of characterising food waste at a national level-An Australian example. Environ. Sci. Policy 2017, 78, 157–166. [Google Scholar] [CrossRef]
- BAP—Banco de Alimentos Perú. Transparencia—Banco de Alimentos Perú; BAP: Lima, Peru, 2018; Available online: https://bancodealimentosperu.org/transparencia (accessed on 25 November 2020).
- Martincus, C.V.; Carballo, J.; Cusolito, A. Roads, exports and employment: Evidence from a developing country. J. Econ. Dev. 2017, 125, 21–39. [Google Scholar] [CrossRef]
- Arribas-Harten, C.; Battistini-Urteaga, T.; Rodriguez-Teves, M.G.; Bernabe-Ortiz, A. Association between obesity and fruit and vegetable consumption: A population-based study in Peru. Rev. Chil. Nutr. 2015, 42, 241–247. [Google Scholar] [CrossRef]
- MINAGRI—Ministerio de Agricultura y Riego, Perú. Sistema de Información de Ccultivos; MINAGRI: Lima, Perú, 2020. Available online: https://sissic.minagri.gob.pe/sissic (accessed on 25 November 2020).
- INEI—National Institute of Statistics and Informatics. Perú: Consumo Per Cápita de los Principales Alimentos 2008–2009. (Peru: Per Capita Consumption of Main Staple Foods 2008–2009). 2012. Available online: https://www.inei.gob.pe/media/MenuRecursivo/publicaciones_digitales/Est/Lib1028/ (accessed on 11 August 2020).
- Morales, L.E.; Higuchi, A. Is fish worth more than meat?—How consumers’ beliefs about health and nutrition affect their willingness to pay more for fish than meat. Food Qual. Prefer. 2018, 65, 101–109. [Google Scholar] [CrossRef]
- Loaiza, I.; De Troch, M.; De Boeck, G. Marine species as safe source of LC-PUFA and micronutrients: Insights in new promising marine food in Peru. Food Chem. 2020, 321, 126724. [Google Scholar] [CrossRef] [PubMed] [Green Version]
- Ambikapathi, R.; Rothstein, J.; Yori, P.; Olortegui, M.; Lee, G.; Kosek, M.; Caulfield, L. Food purchase patterns indicative of household food access insecurity, children’s dietary diversity and intake, and nutritional status using a newly developed and validated tool in the Peruvian Amazon. Food Secur. 2018, 10, 999–1011. [Google Scholar] [CrossRef] [PubMed] [Green Version]
- INEI—National Institute of Statistics and Informatics. Rate of Informality among Men and Women According to Geographic Location. 2018. Available online: https://www.inei.gob.pe/buscador/?tbusqueda=informalidad (accessed on 25 November 2020).
- USDA—United States Department of Agriculture. Peru: Food Processing Ingredients. 2019. Available online: http://agriexchange.apeda.gov.in/MarketReport/Reports/Food_Processing_Ingredients_Lima_Peru_4-22-2019.pdf (accessed on 25 November 2020).
- Lemaire, A.; Limbourg, S. How can food loss and waste management achieve sustainable development goals? J. Clean. Prod. 2019, 234, 1221–1234. [Google Scholar] [CrossRef]
- Peters, D.A. Food Loss and Food Waste, Causes and Solutions. Environ. Pract. 2019, 21, 174–175. [Google Scholar] [CrossRef]
- Thiele, G.; Devaux, A.; Reinoso, I.; Pico, H.; Montesdeoca, F.; Pumisacho, M.; Horton, D. Multi-stakeholder platforms for linking small farmers to value chains: Evidence from the Andes. Int. J. Agric. Sustain. 2011, 9, 423–433. [Google Scholar] [CrossRef]
- Girard, M.; Rebai, N. Circuits courts de commercialisation et transition territoriale dans les Andes. Une réflexion depuis le Pérou et l’Équateur. Cybergeo 2020, 930. [Google Scholar] [CrossRef] [Green Version]
- Zema, D.A.; Calabro, P.S.; Folino, A.; Tamburino, V.; Zappia, G.; Zimbone, S.M. Valorisation of citrus processing waste: A review. J. Waste Manag. 2018, 80, 252–273. [Google Scholar] [CrossRef]
- Jedermann, R.; Nicometo, M.; Uysal, I.; Lang, W. Reducing food losses by intelligent food logistics. Philos. Trans. A Math. Phys. Eng. Sci. 2014, 372. [Google Scholar] [CrossRef]
- Buisman, M.E.; Haijema, R.; Bloemhof-Ruwaard, J.M. Discounting and dynamic shelf life to reduce fresh food waste at retailers. Int. J. Prod. Econ. 2019, 209, 274–284. [Google Scholar] [CrossRef]
- Abbade, E.B. Land and water footprints associated with rice and maize losses in Brazil. Land Use Policy 2020, 99, 105106. [Google Scholar] [CrossRef]
- Chauhan, Y. Food Waste Management with Technological Platforms: Evidence from Indian Food Supply Chains. Sustainability 2020, 12, 8162. [Google Scholar] [CrossRef]
- Bedoya-Perales, N.S.; Pumi, G.; Talamini, E.; Padula, A.D. The quinoa boom in Peru: Will land competition threaten sustainability in one of the cradles of agriculture? Land Use Policy 2018, 79, 475–480. [Google Scholar] [CrossRef]
- Schuster, M.; Maertens, M. Do private standards benefit workers in horticultural export chains in Peru? J. Clean. Prod. 2016, 112, 2392–2406. [Google Scholar] [CrossRef]
Figure 1.
Variables at each step of the food supply chain (FSC). Source: own work based on Dal’ Magro and Talamini [21].
Figure 1.
Variables at each step of the food supply chain (FSC). Source: own work based on Dal’ Magro and Talamini [21].

Figure 2.
Food loss and waste (FLW) in each step of the food supply chain (FSC). Source: own work based on Dal’ Magro and Talamini [21].
Figure 2.
Food loss and waste (FLW) in each step of the food supply chain (FSC). Source: own work based on Dal’ Magro and Talamini [21].

Figure 3.
Percentages of food loss and waste (FLW) by step of the food supply chain (FSC), during (a) the year 2007 and (b) the 2007–2017 period.
Figure 3.
Percentages of food loss and waste (FLW) by step of the food supply chain (FSC), during (a) the year 2007 and (b) the 2007–2017 period.

Figure 4.
Sankey diagram of the Peruvian food supply chain (FSC) (2007–2017). The Sankey diagram demonstrates the mass quantities that comprise each step of the FSC and the food losses and waste (FLW) quantities calculated for the period. The FSC is divided into five steps: Agricultural Production (AP), Postharvest handling and storage (PHS), Processing and packaging (PP), Distribution (D) and Consumption (C). There is a dominant flow direction left to right through different steps (nodes) across the FSC. Vertical lines show the seven commodity groups (CGs), and the width of each link represents the magnitude of flows. Every node indicates where one flow ends and another starts, according to data from the Supplementary Tables S1, S3 and S4. The last node represents the average amount of food consumed, and the average amount of FLW generated in the Peruvian FSC. Flows are expressed in 1000 tonnes.

Figure 5.
Percentages of food loss and waste (FLW) by commodity group (CG), during (a) the year 2007 and (b) the 2007–2017 period
Figure 5.
Percentages of food loss and waste (FLW) by commodity group (CG), during (a) the year 2007 and (b) the 2007–2017 period

Figure 6.
Representation of food loss and waste (FLW) concerning the domestic supply quantity (2007–2017).
Figure 6.
Representation of food loss and waste (FLW) concerning the domestic supply quantity (2007–2017).


Table 1.
Calculated food loss and waste by commodity groups (CGs).
| (a) Calculated average food loss and waste in different CGs for Peru (2007). | ||||||||||||||
| CGs | Production average of FLW for the year (1000 tonnes and %) | |||||||||||||
| Agricultural production | Postharvest handling and storage | Processing and packaging | Distribution | Pre-consumer FLW | Consumption | Total FLW per commodity group | ||||||||
| Cereals | 196.86 | 7.11 | 131.2 | 6.73 | 300.42 | 9.98 | 262.76 | 18.86 | 891.24 | 9.77 | 656.90 | 40.39 | 1548.14 | 14.40 |
| Roots and tubers | 702.1 | 25.34 | 702.1 | 36.04 | 610.32 | 20.27 | 152.49 | 10.94 | 2167.01 | 23.75 | 203.32 | 12.50 | 2370.33 | 22.05 |
| Pulses (only) | 26.22 | 0.95 | 12.9 | 0.66 | 53.04 | 1.76 | 11.98 | 0.86 | 104.14 | 1.14 | 11.98 | 0.74 | 116.12 | 1.08 |
| Fruits and vegetables | 1320.8 | 47.67 | 660.4 | 33.90 | 1339 | 44.46 | 715.2 | 51.33 | 4035.4 | 44.23 | 596.00 | 36.64 | 4631.40 | 43.08 |
| Meat | 59.625 | 2.15 | 12.375 | 0.64 | 57.15 | 1.90 | 57.05 | 4.09 | 186.2 | 2.04 | 68.46 | 4.21 | 254.66 | 2.37 |
| Fish and seafood | 413.136 | 14.91 | 340.5 | 17.48 | 618.21 | 20.53 | 70.1 | 5.03 | 1441.946 | 15.80 | 28.04 | 1.72 | 1469.99 | 13.67 |
| Milk | 51.73 | 1.87 | 88.68 | 4.55 | 33.28 | 1.11 | 123.76 | 8.88 | 297.45 | 3.26 | 61.88 | 3.80 | 359.33 | 3.34 |
| FLW total | 2770.47 | 100.00 | 1948.16 | 100.00 | 3011.42 | 100.00 | 1393.34 | 100.00 | 9123.386 | 100.00 | 1626.58 | 100.00 | 10,749.97 | 100.00 |
| (b) Calculated average food loss and waste in different CGs for Peru (2017). | ||||||||||||||
| CGs | Production average of FLW for the year (1000 tonnes and %) | |||||||||||||
| Agricultural production | Postharvest handling and storage | Processing and packaging | Distribution | Pre-consumer FLW | Consumption | Total FLW per commodity group | ||||||||
| Cereals | 303.78 | 8.52 | 209.16 | 8.36 | 522.00 | 13.09 | 455.24 | 23.58 | 1490.18 | 12.43 | 1138.10 | 46.99 | 2628.28 | 18.24 |
| Roots and tubers | 910.70 | 25.55 | 910.70 | 36.39 | 787.20 | 19.75 | 196.14 | 10.16 | 2804.74 | 23.40 | 261.52 | 10.80 | 3066.26 | 21.28 |
| Pulses (only) | 75.66 | 2.12 | 38.31 | 1.53 | 139.44 | 3.50 | 33.14 | 1.72 | 286.55 | 2.39 | 33.14 | 1.37 | 319.69 | 2.22 |
| Fruits and vegetables | 1860.00 | 52.18 | 930.00 | 37.16 | 1891.20 | 47.44 | 915.96 | 47.44 | 5597.16 | 46.70 | 763.30 | 31.51 | 6360.46 | 44.15 |
| Meat | 100.44 | 2.82 | 20.85 | 0.83 | 98.55 | 2.47 | 98.40 | 5.10 | 318.23 | 2.66 | 118.08 | 4.88 | 436.31 | 3.03 |
| Fish and seafood | 242.65 | 6.81 | 271.30 | 10.84 | 506.16 | 12.70 | 79.60 | 4.12 | 1099.71 | 9.18 | 31.84 | 1.31 | 1131.55 | 7.85 |
| Milk | 71.23 | 2.00 | 122.10 | 4.88 | 41.88 | 2.03 | 152.32 | 7.89 | 387.53 | 3.23 | 76.16 | 3.14 | 463.69 | 3.22 |
| FLW total | 3564.45 | 100.00 | 2502.42 | 100.00 | 3986.43 | 100.00 | 1930.80 | 100.00 | 11,984.09 | 100.00 | 2422.14 | 100.00 | 14,406.23 | 100.00 |
| (c) Calculated average food loss and waste in different CGs for Peru (2007–2017). | ||||||||||||||
| CGs | Production average of FLW for the year (1000 tonnes and %) | |||||||||||||
| Agricultural production | Postharvest handling and storage | Processing and packaging | Distribution | Pre-consumer FLW | Consumption | Total FLW per commodity group | ||||||||
| Cereals | 261.51 | 8.03 | 175.02 | 7.69 | 395.06 | 11.15 | 344.19 | 20.43 | 1175.78 | 10.93 | 860.46 | 42.65 | 2036.24 | 15.93 |
| Roots and tubers | 832.10 | 25.55 | 832.10 | 36.56 | 724.34 | 20.44 | 180.77 | 10.73 | 2569.31 | 23.87 | 241.03 | 11.95 | 2810.34 | 21.99 |
| Pulses (only) | 42.89 | 1.32 | 21.62 | 0.95 | 84.28 | 2.38 | 19.41 | 1.15 | 168.21 | 1.56 | 19.41 | 0.96 | 187.62 | 1.47 |
| Fruits and vegetables | 1625.40 | 49.90 | 812.70 | 35.71 | 1653.27 | 46.64 | 838.00 | 49.75 | 4929.38 | 45.80 | 698.34 | 34.61 | 5627.71 | 44.04 |
| Meat | 81.47 | 2.50 | 16.91 | 0.74 | 78.87 | 2.23 | 78.69 | 4.67 | 255.94 | 2.38 | 94.42 | 4.68 | 350.36 | 2.74 |
| Fish and seafood | 351.12 | 10.78 | 310.16 | 13.63 | 568.95 | 16.05 | 77.29 | 4.59 | 1307.52 | 12.15 | 30.92 | 1.53 | 1338.43 | 10.47 |
| Milk | 62.59 | 1.92 | 107.29 | 4.71 | 39.68 | 2.29 | 145.98 | 8.67 | 355.54 | 3.30 | 72.99 | 3.62 | 428.53 | 3.35 |
| FLW total | 3257.08 | 100.00 | 2275.80 | 100.00 | 3544.47 | 100.00 | 1684.33 | 100.00 | 10,761.67 | 100.00 | 2017.57 | 100.00 | 12,779.24 | 100.00 |
Table 2.
Estimates of total and per capita food loss and waste in Peru.
| Steps in the Food Supply Chain | Food Loss and Waste (1000 Tonnes) | Food Loss and Waste (kg/Inhabitant) | FLW Edible Proportion d (1000 Tonnes) | FLW Edible Proportion (kg/Inhabitant) | ||||||||
|---|---|---|---|---|---|---|---|---|---|---|---|---|
| Total (2007) | Total (2017) | Total (2007–2017 Average) | 2007 a | 2017 b | 2007–2017 c | Total (2007) | Total (2017) | Total (2007–2017 Average) | 2007 a | 2017 b | 2007–2017 c | |
| Agricultural production | 2770.47 | 3564.45 | 3257.08 | 97.78 | 125.81 | 108.72 | 2133.26 | 2744.63 | 2507.95 | 75.29 | 85.33 | 83.71 |
| Postharvest handling | 1948.16 | 2502.42 | 2275.80 | 68.76 | 88.32 | 75.96 | 1500.08 | 1926.86 | 1752.37 | 52.94 | 59.90 | 58.49 |
| Processing and packaging | 3011.42 | 3986.43 | 3544.47 | 106.29 | 140.70 | 118.31 | 2258.57 | 2989.82 | 2658.35 | 79.71 | 92.95 | 88.73 |
| Distribution | 1393.34 | 1930.80 | 1684.33 | 49.18 | 68.15 | 56.22 | 1072.87 | 1486.72 | 1296.93 | 37.87 | 46.22 | 43.29 |
| Consumption at household level | 1626.58 | 2422.14 | 2017.57 | 57.41 | 85.49 | 67.34 | 1252.47 | 1865.05 | 1553.53 | 44.21 | 57.98 | 51.85 |
| FLW total | 10,749.97 | 14,406.23 | 12,779.24 | 379.41 | 508.46 | 426.56 | 8217.25 | 11,013.08 | 9769.12 | 290.02 | 342.39 | 326.08 |
a Population = 28,333,052; b Population = 32,165,480; c Population mean = 29.959.103; d Edible proportion: 77% (agricultural production); 77% (postharvest handling); 75% (processing and packaging); 77% (distribution mean); 77% (consumption at household level mean).
Publisher’s Note: MDPI stays neutral with regard to jurisdictional claims in published maps and institutional affiliations. |
© 2021 by the authors. Licensee MDPI, Basel, Switzerland. This article is an open access article distributed under the terms and conditions of the Creative Commons Attribution (CC BY) license (http://creativecommons.org/licenses/by/4.0/).
Share and Cite
MDPI and ACS Style
Bedoya-Perales, N.S.; Dal’ Magro, G.P. Quantification of Food Losses and Waste in Peru: A Mass Flow Analysis along the Food Supply Chain. Sustainability 2021, 13, 2807. https://doi.org/10.3390/su13052807
AMA Style
Bedoya-Perales NS, Dal’ Magro GP. Quantification of Food Losses and Waste in Peru: A Mass Flow Analysis along the Food Supply Chain. Sustainability. 2021; 13(5):2807. https://doi.org/10.3390/su13052807
Chicago/Turabian StyleBedoya-Perales, Noelia S., and Glenio Piran Dal’ Magro. 2021. "Quantification of Food Losses and Waste in Peru: A Mass Flow Analysis along the Food Supply Chain" Sustainability 13, no. 5: 2807. https://doi.org/10.3390/su13052807
Note that from the first issue of 2016, this journal uses article numbers instead of page numbers. See further details here.