
")
China Dairy Market & Forecast by Type (Liquid Milk, Milk Powder, Other), Product, Production & Consumption Volume, Import, Export Volume, & Company Analysis
Get Free Customization in This Report
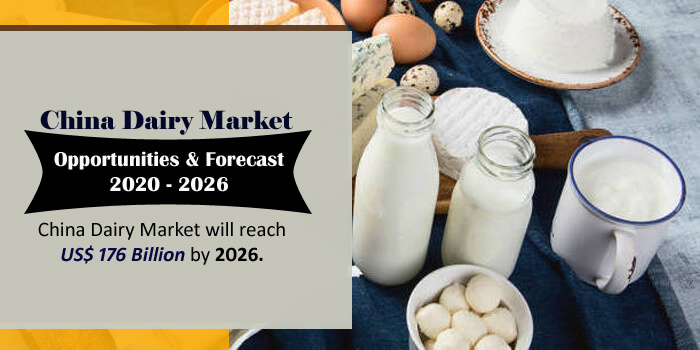
China is one of the world’s largest dairy consumers for the last few decades. Dairy consumption has increased in China with the growth in per capita income annually. Past decades have seen a soar in China dairy production and consumption. Government of China has been issuing new plans, policies and regulations to modernize production, improve food safety and quality. China is not self-sufficient in dairy production, and their productivity is also declining from the past few years, so imports fulfill the majority of dairy demands. According to Renub Research, China Dairy Market will reach US$ 176 Billion by 2026.
In China, leading dairy products are yogurt, liquid milk and infant milk formula. In 2019, yogurt and milk powder showed the fastest growth of these major categories. Food safety issues have significantly changed Chinese consumer choices. Upper and middle class prefer to pay higher prices for imported dairy products which they consider safer and better. Europe leads in dairy export to China, followed by the United States and New Zealand. Since the majority of imports of dairy products are from foreign companies, the government has put regulations that whichever companies that are not registered in China are not allowed to sell the products anywhere within the Chinese boundaries.
The three Chinese dairy companies Yili, Mengniu and Bright make a significant market in sales for liquid milk in 2019. Global companies have also entered the Chinese market by exporting dairy products and selling through online grocery services such as Tesco Plc, and large retailers like Yihaodian. Covid-19 pandemic has raised people's health awareness and deepened consumers' understanding of the nutritional value of milk and dairy products in China.
Renub Research report titled “China Dairy Market & Forecast by Category ( Liquid Milk, Milk Powder, Other), Product (Yogurt, Ice Cream, Probiotic, Cheese, Butter and Margarine, Infant Formula, Flavored Milk Drinks, UHT Milk, Other Dairy Products), Production & Consumption Volume (Food Use, Feed Use, Others Use), Import Volume (Liquid Milk, Cheese, Whole Milk Powder, Skimmed Milk Powder, Whey, Infant Formula), Export Volume, Company (China Mengniu Dairy Company Limited, Inner Mongolia Yili Industrial Group Co., Ltd, China Modern Dairy Holdings Ltd, Bright Dairy & Food Co.,Ltd)” provides a complete analysis of Chinese Dairy Market.
Category – Report Studies the Market of the Following Milk Categories & Sub-categories
• Liquid Milk (Premium, Regular)
• Milk Powder (Premium, Regular)
• Other
Product – Dairy Market in China is divided in 9 products
1. Yoghurt (Drinking Yoghurt, Spoonable Yoghurt)
2. Ice Cream
3. Probiotic
4. Cheese (Cream Cheese, Other Cheese)
5. Butter and Margarine
6. Infant Formula
7. Flavored Milk Drinks
8. UHT Milk
9. Other Dairy Products
By Dairy Production & Consumption Volume
The report studies China total milk present and future production volume. This report also provides the details of the consumption volume of the following use type: food use, feed use and others use.
By Dairy Product Import & Export Volume
This report provides the details of the import volume of the following product: liquid milk, cheese, whole milk powder, skimmed milk powder, whey, infant formula. This report also explains dairy products export volume and forecast.
Companies Analysis
China Mengniu Dairy Company Limited, Inner Mongolia Yili Industrial Group Co., Ltd, China Modern Dairy Holdings Ltd, Bright Dairy & Food Co., Ltd has been studied thoroughly in the report.
All the Companies Studied in the Report have been Studied from 3 Points
• Company Overview
• Company Initiatives
• Financial Insight
Companies Covered in this Report
• China Mengniu Dairy Company Limited
• Inner Mongolia Yili Industrial Group Co., Ltd
• China Modern Dairy Holdings Ltd
• Bright Dairy & Food Co.,Ltd
By Dairy Production & Consumption Volume
• Food Use
• Feed Use
• Others Use
By Dairy Products Import Volume
• Liquid Milk
• Cheese
• Whole Milk Powder
• Skimmed Milk Powder
• Whey
• Infant Formula
If the information you seek is not included in the current scope of the study kindly share your specific requirements with our custom research team at info@renub.com
1. Introduction
2. Research Methodology
3. Executive Summary
4. China Dairy Market
5. Market Share – China Dairy
5.1 By Type
5.2 By Products
5.3 By Products – Volume Share
6. Type – China Dairy Milk Market
6.1 Liquid Milk
6.1.1 Premium Liquid Milk
6.1.2 Regular Liquid milk
6.2 Milk Powder
6.2.1 Premium Milk Powder
6.2.2 Regular Milk Powder
6.3 Other Dairy Milk Products
7. Products – China Dairy Market
7.1 Yoghurt
7.1.1 Drinking Yogurt
7.1.2 Spoonable Yogurt
7.2 Ice Cream
7.3 Probiotic
7.4 Cheese
7.4.1 Cream Cheese
7.4.2 Others Cheese
7.5 Butter and Margarine
7.6 Infant Formula
7.7 Flavored Milk Drinks
7.8 UHT Milk
7.9 Other Dairy Products
8. China Dairy Market Supply & Demand Analysis
8.1 China Dairy Products Production
8.2 China Dairy Products Consumption
8.2.1 China Dairy Products Food Use Consumption
8.2.2 China Dairy Products Feed Use Consumption
8.2.3 China Dairy Products Others Use Consumption
8.3 China Dairy Products Losses
9. China Dairy Products Import and Export Status
9.1 China Dairy Products Imports
9.1.1 Liquid Milk
9.1.2 Cheese
9.1.3 Whole Milk Powder
9.1.4 Skimmed Milk Powder
9.1.5 Whey
9.1.6 Infant Formula
9.2 China Dairy Products Exports
10. Growth Drivers
10.1 The Chinese Government Support and Strict Regulations
10.2 The Expanding Middle Class
10.3 Growing Health Consciousness
11. Challenges
11.1 New Milk Regulations in China
11.2 Dairy Product Safety Issue
12. Comapny Analysis
12.1 China Mengniu Dairy Company Limited
12.1.1 Company Overview
12.1.2 Initiatives
12.1.3 Financial Insight
12.2 Inner Mongolia Yili Industrial Group Co., Ltd
12.2.1 Company Overview
12.2.2 Initiatives
12.2.3 Financial Insight
12.3 China Modern Dairy Holdings Ltd
12.3.1 Company Overview
12.3.2 Initiatives
12.3.3 Financial Insight
12.4 Bright Dairy & Food Co.,Ltd
12.4.1 Company Overview
12.4.2 Products/Initiatives
12.4.3 Financial Insight
List of Figures:
Figure 4‑1: China – Dairy Market (Billion US$), 2015 – 2019
Figure 4‑2: China – Forecast for Dairy Market (Billion US$), 2020 – 2026
Figure 5‑1: China – By Types Dairy Market Share (Percent), 2015 – 2019
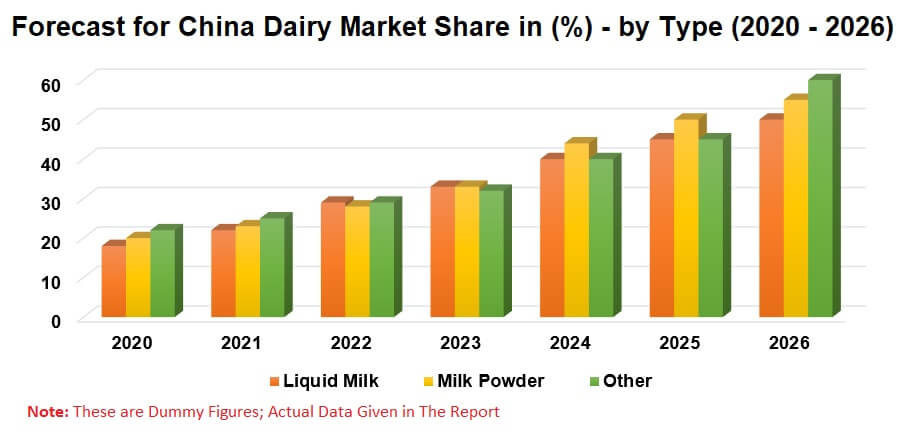
Figure 5‑2: China – Forecast for By Types Dairy Market Share (Percent), 2020 – 2026
Figure 5‑3: China – By Products Dairy Import Volume Share (Percent), 2015 – 2019
Figure 5‑4: China – Forecast for By Products Dairy Import Volume Share (Percent), 2020 – 2026
Figure 6‑1: China – Liquid Milk Market (Million US$), 2015 – 2019
Figure 6‑2: China – Forecast for Liquid Milk Market (Million US$), 2020 – 2026
Figure 6‑3: China – Premium Liquid Milk Market (Million US$), 2015 – 2019
Figure 6‑4: China – Forecast for Premium Liquid Milk Market (Million US$), 2020 – 2026
Figure 6‑5: China – Regular Liquid Milk Market (Million US$), 2015 – 2019
Figure 6‑6: China – Forecast for Regular Liquid Milk Market (Million US$), 2020 – 2026
Figure 6‑7: China – Milk Powder Market (Million US$), 2015 – 2019
Figure 6‑8: China – Forecast for Milk Powder Market (Million US$), 2020 – 2026
Figure 6‑9: China – Premium Milk Powder Market (Million US$), 2015 – 2019
Figure 6‑10: China – Forecast for Premium Milk Powder Market (Million US$), 2020 – 2026
Figure 6‑11: China – Regular Milk Powder Market (Million US$), 2015 – 2019
Figure 6‑12: China – Forecast for Regular Milk Powder Market (Million US$), 2020 – 2026
Figure 6‑13: China – Other Dairy Market (Million US$), 2015 – 2019
Figure 6‑14: China – Forecast for Other Dairy Market (Million US$), 2020 – 2026
Figure 7‑1: China – Yogurt Market (Million US$), 2015 – 2019
Figure 7‑2: China – Forecast for Yogurt Market (Million US$), 2020 – 2026
Figure 7‑3: China – Drinking Yogurt Market (Million US$), 2015 – 2019
Figure 7‑4: China – Forecast for Drinking Yogurt Market (Million US$), 2020 – 2026
Figure 7‑5: China – Spoonable Yogurt Market (Million US$), 2015 – 2019
Figure 7‑6: China – Forecast for Spoonable Yogurt Market (Million US$), 2020 – 2026
Figure 7‑7: China – Ice Cream Market (Million US$), 2015 – 2019
Figure 7‑8: China – Forecast for Ice Cream Market (Million US$), 2020 – 2026
Figure 7‑9: China – Probiotic Products Market (Million US$), 2015 – 2019
Figure 7‑10: China – Forecast for Probiotic Products Market (Million US$), 2020 – 2026
Figure 7‑11: China – Cheese Market (Million US$), 2015 – 2019
Figure 7‑12: China – Forecast for Cheese Market (Million US$), 2020 – 2026
Figure 7‑13: China – Cream Cheese Market (Million US$), 2015 – 2019
Figure 7‑14: China – Forecast for Cream Cheese Market (Million US$), 2020 – 2026
Figure 7‑15: China – Others Cheese Market (Million US$), 2015 – 2019
Figure 7‑16: China – Forecast for Others Cheese Market (Million US$), 2020 – 2026
Figure 7‑17: China – Butter and Margarine Market (Million US$), 2015 – 2019
Figure 7‑18: China – Forecast for Butter and Margarine Market (Million US$), 2020 – 2026
Figure 7‑19: China – Infant Formula Market (Million US$), 2015 – 2019
Figure 7‑20: China – Forecast for Infant Formula Market (Million US$), 2020 – 2026
Figure 7‑21: China – Flavored Milk Drinks Market (Million US$), 2015 – 2019
Figure 7‑22: China – Forecast for Flavored Milk Drinks Market (Million US$), 2020 – 2026
Figure 7‑23: China – UHT Milk Market (Million US$), 2015 – 2019
Figure 7‑24: China – Forecast for UHT Milk Market (Million US$), 2020 – 2026
Figure 7‑25: China – Other Dairy Products Market (Million US$), 2015 – 2019
Figure 7‑26: China – Forecast for Other Dairy Products Market (Million US$), 2020 – 2026
Figure 8‑1: China – Dairy Products Production (Ten Thousand Metric Tons), 2015 – 2019
Figure 8‑2: China – Forecast For Dairy Products Production (Ten Thousand Metric Tons), 2020 – 2026
Figure 8‑3: China – Dairy Products Consumption (Ten Thousand Metric Tons), 2015 – 2019
Figure 8‑4: China – Forecast For Dairy Products Consumption (Ten Thousand Metric Tons), 2020 – 2026
Figure 8‑5: China – Dairy Products Food Use Consumption (Ten Thousand Metric Tons), 2015 – 2019
Figure 8‑6: China – Forecast For Dairy Products Food Use Consumption (Ten Thousand Metric Tons), 2020 – 2026
Figure 8‑7: China – Dairy Products Feed Use Consumption (Ten Thousand Metric Tons), 2015 – 2019
Figure 8‑8: China – Forecast For Dairy Products Feed Use Consumption (Ten Thousand Metric Tons), 2020 – 2026
Figure 8‑9: China – Dairy Products Others Use Consumption (Ten Thousand Metric Tons), 2015 – 2019
Figure 8‑10: China – Forecast For Dairy Products Others Use Consumption (Ten Thousand Metric Tons), 2020 – 2026
Figure 8‑11: China – Dairy Products Losses (Ten Thousand Metric Tons), 2015 – 2019
Figure 8‑12: China – Forecast For Dairy Products Losses (Ten Thousand Metric Tons), 2020 – 2026
Figure 9‑1: China – Dairy Products Imports Volume (Thousand Metric Tons), 2015 – 2019
Figure 9‑2: China – Forecast for Dairy Products Imports Volume (Thousand Metric Tons), 2020 – 2026
Figure 9‑3: China – Liquid Milk Products Imports Volume (Thousand Metric Tons), 2015 – 2019
Figure 9‑4: China – Forecast for Liquid Milk Products Imports Volume (Thousand Metric Tons), 2020 – 2026
Figure 9‑5: China – Cheese Products Imports Volume (Thousand Metric Tons), 2015 – 2019
Figure 9‑6: China – Forecast for Cheese Products Imports Volume (Thousand Metric Tons), 2020 – 2026
Figure 9‑7: China – Whole Milk Power Imports Volume (Thousand Metric Tons), 2015 – 2019
Figure 9‑8: China – Forecast for Whole Milk Power Imports Volume (Thousand Metric Tons), 2020 – 2026
Figure 9‑9: China – Skimmed Milk Powder Imports Volume (Thousand Metric Tons), 2015 – 2019
Figure 9‑10: China – Forecast for Skimmed Milk Powder Imports Volume (Thousand Metric Tons), 2020 – 2026
Figure 9‑11: China – Whey Products Imports Volume (Thousand Metric Tons), 2015 – 2019
Figure 9‑12: China – Forecast for Whey Products Imports Volume (Thousand Metric Tons), 2020 – 2026
Figure 9‑13: China – Infant Formula Products Imports Volume (Thousand Metric Tons), 2015 – 2019
Figure 9‑14: China – Forecast for Infant Formula Products Imports Volume (Thousand Metric Tons), 2020 – 2026
Figure 9‑15: China – Dairy Products Exports Volume (Ten Thousand Metric Tons), 2015 – 2019
Figure 9‑16: China – Forecast for Dairy Products Exports Volume (Ten Thousand Metric Tons), 2020 – 2026
Figure 10‑1: China – Change in Disposable Income (US$), 2013 – 2017
Figure 12‑1: China Mengniu Dairy – Sales (Million US$), 2015 – 2019
Figure 12‑2: China Mengniu Dairy – Forecast for Sales (Million US$), 2020 – 2026
Figure 13‑1: Inner Mongolia Yili Industrial Group – Sales (Billion US$), 2015 – 2019
Figure 13‑2: Inner Mongolia Yili Industrial Group – Forecast for Sales (Billion US$), 2020 – 2026
Figure 14‑1: China Modern Dairy – Sales (Million US$), 2015 – 2019
Figure 14‑2: China Modern Dairy – Forecast for Sales (Million US$), 2020 – 2026
Figure 15‑1: Bright Dairy – Sales (Million US$), 2015 – 2019
Figure 15‑2: Bright Dairy – Forecast for Sales (Million US$), 2020 – 2026
List of Tables:
Table 5‑1: China – By Products Dairy Market Share (Percent), 2015 – 2019
Table 5‑2: China – Forecast for By Products Dairy Market Share (Percent), 2020 – 2026
Reach out to us
Call us on
USA: +1-678-302-0700
INDIA: +91-120-421-9822
Drop us an email at
info@renub.com