
American Rescue Plan Act (ARPA) And Drinking Water Infrastructure Opportunities
By Dave Cox

As the $1 trillion infrastructure bill passed by the Senate last month would authorize $55 billion in federal spending on water and wastewater infrastructure, contractors in the space are no doubt keeping a close eye on it.
They would do well, however, not to overlook the business opportunities already available to them from the federal spending authorized by a bill that President Biden signed into law in March.
ARPA Overview
The American Rescue Plan Act of 2021, also known as ARPA, authorized $1.9 trillion in funding to help the economy recover from the COVID-19 pandemic. It is best known for having enabled roughly 170 million Americans so far to get a $1,400 check from the federal government, but it also established the Coronavirus State Fiscal Recovery Fund and the Coronavirus Local Fiscal Recovery Fund to provide $350 billion in emergency funding to eligible state, local, tribal, and tribal governments.
Governments that receive money from the funds can use it to support public health; address economic harm done by the pandemic; replace public sector revenue lost due to the pandemic; provide premium pay to essential workers; and, most importantly for Water Online readers, invest in water, sewer, and broadband infrastructure.
Money from the funds is being allocated in the following manner:
- States and the District of Columbia — $195.3 billion
- Counties — $65.1 billion
- Metropolitan cities — $45.57 billion
- Tribal governments — $20 billion
- Non-entitlement units (NEUs) of local government — $19.53 billion
- Territories — $4.5 billion
Distribution Method And Timing
The Treasury Department is distributing money from the funds directly to states, counties, metropolitan cities, tribal governments, and territories. For NEUs, which are cities, villages, towns, and townships with populations of less than 50,000, the department is distributing money from the funds to the states, which will then pass it on to the NEUs.
Most entities are getting money from the funds in two tranches with only territorial governments receiving a single payment. States that saw their unemployment rise more than 2 percentage points between February 20 and the date they were certified to receive their money are getting it in one payment; the rest are getting it in two equal tranches. As of August 20, the Treasury Department had determined that 31 states either will receive their money in two tranches or would receive it in two tranches based on the August 20 unemployment data. A list of the states and whether they will or would get their ARPA money in one or two tranches can be found here.
Local governments (i.e., counties, metropolitan cities, and NEUs) were to have gotten half their money in May and are to get the rest around next May. Tribes were to have received the first of two payments in May and the second in June, although since the second payment was based on employment data, tribes had to provide that to the Treasury Department in order to get it.
Entities receiving ARPA money must allocate it by the end of 2024 and spend it by the end of 2026, which means the water and wastewater infrastructure projects that wind up being funded by ARPA likely will be ones that are at least already proposed and, in many cases, shovel ready. As a result, a large number of them have been mentioned, if not described in depth, in the capital improvement plans or capital improvement programs (CIPs) that state and local governments, their agencies and regional authorities are required to issue if they use public funds. (I wrote an article for Water Online in late June about how contractors can use CIPs to find projects to bid on.)
Of course, how many projects a state or local agency can fund from ARPA money depends on how much ARPA money it gets. And the Treasury Department’s method of allocating ARPA money varies according to the entities that are receiving it.
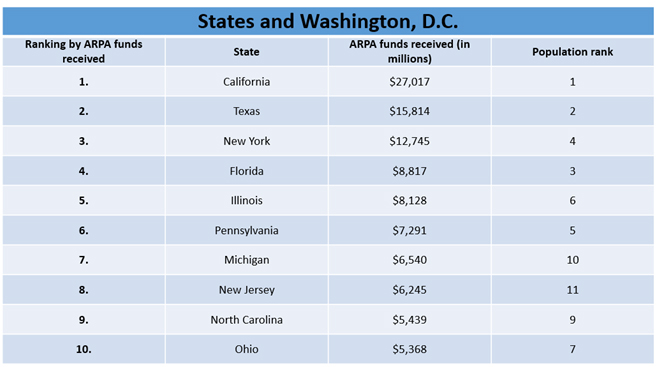
States And Washington, D.C.
Of the $195.3 billion going to the states and District of Columbia, $25.5 billion is being split equally among them. Washington, D.C., also is receiving an extra $754.9 million for reasons not worth explaining here. The remainder is being distributed according to a formula that takes into account the number of seasonally adjusted unemployed people in each state and the district during the three-month period ending December 20, 2020. As the table below shows, the result is that the ranking of states by the total amount of money they received is the same as their ranking due to the amount of money they received as a result of the number of seasonally adjusted unemployed people they contained and differs somewhat from their ranking by population.
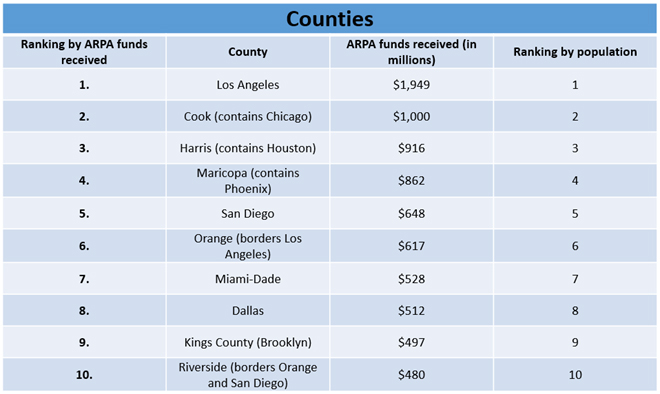
Counties And Metropolitan Cities
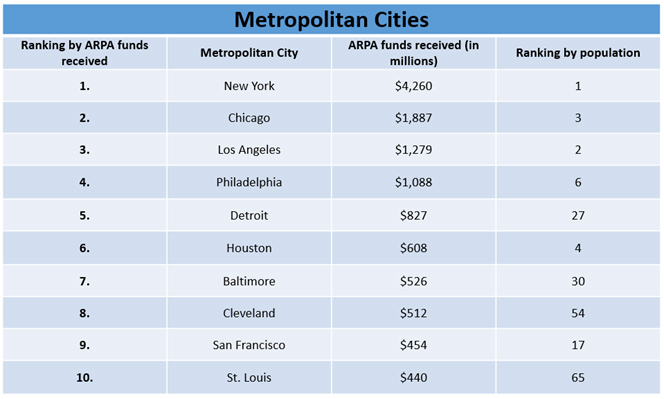
The $65.1 billion that counties are to receive is being distributed according to their populations and the Community Development Block Grant formula found in the Housing and Community Development Act of 1974, the latter of which also is being used to determine how the $45.57 billion earmarked for metropolitan cities is being distributed.
As the tables below show, the use of the CDBG formula didn’t have much of an impact on how much ARPA money the nation’s 10 largest counties got, as their rankings by ARPA money received are the same as their rankings by population. It did, however, have a huge impact on how much money the metropolitan cities received. (Metropolitan cities are either the central cities in their metropolitan areas or cities with populations ≥ 50,000.)
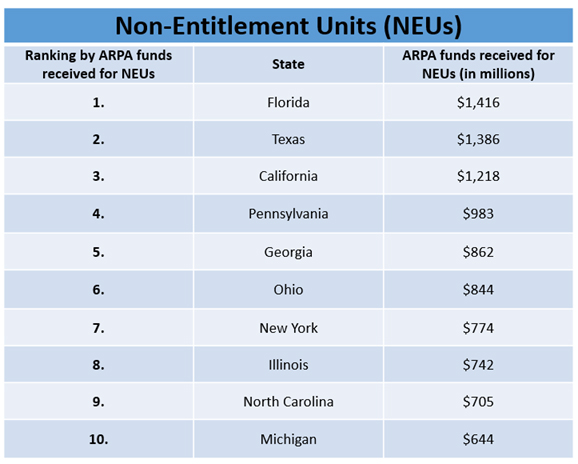
NEUs
The $19.53 billion going to NEUs is being allocated to states based on the populations of their NEUs. Here are the states that are the top 10 recipients of ARPA money for their NEUs.
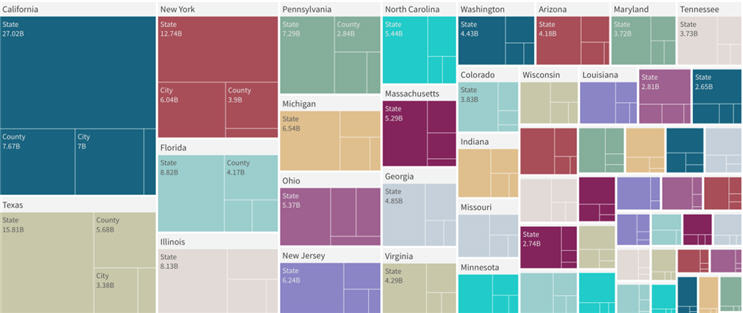
Total Amount By State
Although each state receives ARPA money that it can spend, the total amount of ARPA money flowing to a state is greater than just that because it also includes money designated for the state’s counties, metropolitan cities and NEUs. FirmoGraphs, the business intelligence company that I run, used U.S. Treasury data to make not only the tables displayed above but also the chart below, which is called a treemap and shows the states and Washington, D.C., in sizes proportionate to the ARPA money that they, their counties, metropolitan cities and NEUs will receive.
Tracking State ARPA Spending
For water and wastewater infrastructure contractors, knowing the government entities that have gotten, are getting or will get ARPA funding is important, but it’s just the first step. The next step is figuring out the projects they will use the money to fund. A good place to start is by seeing how the states, which are getting the largest chunk of the ARPA money, are allocating it.
As of July 15, most states had received the first half of their ARPA money and a small number had received all of it, according to a report by Drexel University’s Nowak Metro Finance Lab. The report said most of the states were using a regular budget process to allocate their money, six had set up a smaller advisory group and Wisconsin was having its governor do the allocation.
Twenty-six states have fully or partially appropriated their ARPA money, incorporating part of it into their 2022 fiscal budgets and leaving the rest to be appropriated in future legislative sessions, according to the report. The amount they’ve appropriated ranges from nearly 100 percent (Indiana) to 0.5 percent (Maine). The remaining 24 states likely will appropriate the money in upcoming special or regular legislative sessions, according to the report.
At least two states so far have made sizable appropriations to water and sewer infrastructure. The report said Montana allocated $462.7 million, or 51 percent of its initial ARPA allocation, and Kentucky allocated $250 million (11 percent).
Finding out how a state plans to spend its ARPA money can be difficult. The report said many states have put their allocations in their normal budgets, which makes them hard to track. To speed the process, the National Conference of State Legislatures has created a tool for tracking ARPA allocations by state.
Tracking Local ARPA Spending
Following what local governments are doing with ARPA money appears to be easier. Counties seem to be doing a good job of announcing the process by which they’re determining how to spend their ARPA money, with many getting their residents involved. That’s also true of at least some metropolitan cities. Money going to NEUs can be tracked at two levels, as states are announcing distributions of it and many NEUs, like counties and metropolitan cities, are keeping their residents informed and often seeking their input on how best to spend the ARPA money they receive.
Water and wastewater infrastructure contractors, therefore, would do well to monitor the websites of the counties, cities and NEUs they do business with or want to do business with, as well as the websites of the media that cover them, such as local newspapers and TV and radio stations. Doing that will enable them to find stories like this one from the Helena Independent Record on ARPA-funded water and wastewater projects in Helena and East Helena, Montana, or this one from Vermont Business Magazine that details Burlington’s plan for spending nearly $1.8 million in ARPA money, $860,000 of which is going to work on the city’s water, wastewater, and stormwater systems.
To be able to anticipate such stories or announcements, contractors can, as I said earlier, look at the CIPs of their current and potential government clients. These typically list the capital projects that the governments, agencies and/or authorities are committed to undertaking or would like to undertake in the next five years, enabling contractors to know what projects are likely to be funded with ARPA money so they can be prepared to bid on them.
 Dave Cox is the president and founder of FirmoGraphs, a business focused on applying Business Intelligence (BI) to North American industrial and utility operations (see www.firmographs.com). He earned a BS in Civil Engineering from the University of California at Berkeley, and an MS from the University of Texas at Austin in environmental engineering. He is a California Professional Civil Engineer. Dave has spent his 30-year career doing engineering, marketing, and sales work with asset-intensive organizations in the energy, water, oil, and technology industries. He is passionate about using data to help North American industry make better decisions to improve both financial performance and the environment.