
")
Olive Oil Market, Size, Global Forecast 2023-2028, Industry Trends, Growth, Share, Outlook, Impact of Inflation, Opportunity Company Analysis
Olive Oil Market Outlook
Global Olive Oil Market will reach US$ 17.93 Billion by 2028, according to Renub Research. Olive Oil is a leading crop worldwide; on an average, millions of Tons are produced yearly. It is the natural Oil extracted from olives, the fruit of the olive tree, and made by grinding and removing the Oil by mechanical or chemical means. As per our research findings, Global Olive Oil Industry will grow at a CAGR of 6.48% from 2022 to 2028.
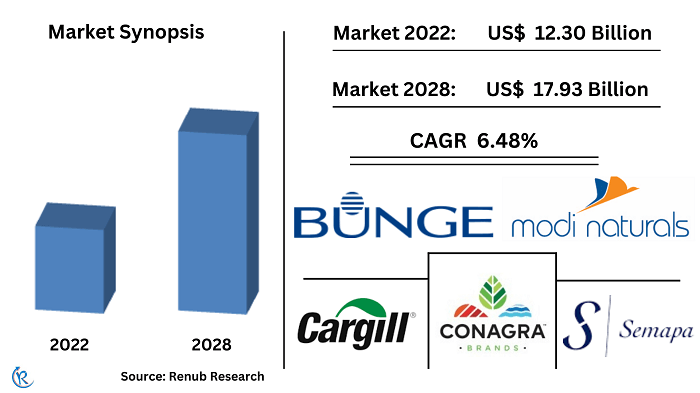
Moreover, rising awareness among consumers regarding health benefits and massive demand for olive Oil in different industries like food & beverages, personal care products, and the pharmaceutical industry has significantly driven the market. However, High costs and climate and economic problems create the biggest challenges for the olive oil market's growth.
Olive Oil Companies News
Modi Naturals
In 2024, Modi Naturals plans to launch the Oleev Kitchen sub-brand, which will offer pasta and peanut butter. The company aims to generate 3% of its business from this sub-brand in the first year and 5–10% in the following years.
Modi Naturals Limited (MNL) has partnered with health enthusiast Kalki Koechlin to promote their flagship product, Oleev Olive Pomace Oil. Oleev is the brand of MNL that deals with food and beverages. The partnership was formed in 2023.
Cargill Inc
In June 2022, Cargill announced plans to construct a new USD 200 Million palm oil refinery in Indonesia to boost its efforts to broaden a sustainable palm delivery chain and offer established deforestation-unfastened products to customers.
In 2023, Cargill forayed into India with its edible oil portfolio and launched Gemini Pureit™, India’s leading sunflower oil brand in the region.
Bunge Limited
In October 2023, Bunge Ltd.'s joint venture with IOI Corporation is set to acquire a newly constructed, port-based refinery from Fuji Oil New Orleans, LLC. The refinery is situated in the Avondale Terminal of International-Matex Tank Terminals in Louisiana.
June 2023, Bunge Ltd. and Chevron's Renewable Energy Group Inc., a Chevron Corp. subsidiary, acquired Argentinian seed company ChacraserviciosSrl. from Italian energy company Adamant Group.
Olive oil consumption has changed significantly in the EU 27
By Consumption, the Olive oil industry has been classified into eleven parts EU-27, Turkey, Morocco, Tunisia, Syrian Arab Republic, Algeria, Argentina, Lebanon, Jordan, Chile, and Others. EU-27 captured the largest market share due to increasing per capita income; useful in skin care products, helps reduce the risk of heart disease and cancer like breast and colorectal cancer, and mainly drives the market.
In the EU, Italy and Spain are the largest consumers of olive oil, with annual consumptions of around 500,000 tons each. At the same time, Greece has the most extensive EU most significant pitta consumption, with about 14/per person per year.
Furthermore, Olive oil consumption is also growing in the Asia-Pacific region. However, Japan, Korea, and China are still the top destination countries with more consumption rate in 2022. According to this research report, Worldwide Olive Oil Market was US$ 12.30 Billion in 2022.
Europe is the continent that produces the enormous amount of Olive Oil in the World
Based on Production, the Olive Oil market globally was segmented into eleven such EU-27, Turkey, Morocco, Tunisia, Syrian Arab Republic, Algeria, Argentina, Lebanon, Jordan, Chile, and Others. In the Production list of the top 10 largest olive oil countries in the world, four are European, with Spain, Greece, and Italy sitting at the top.
The cultivation of olive trees mainly drives the growth and demand of high-quality oil farmers' awareness and socio-economic culture. According to the Food Information and Control Agency, Spain produced 1.3 million Tunes of olive Oil in 2021, accounting for 42% of global olive oil production. All of them are countries belonging to the Mediterranean basin. Therefore, the Production of these countries accounts for about 80% of world production.
United States is the Largest Olive Oil Importer
By Import, the Olive Oil industry is divided into eleven types: United States, EU-27, Brazil, Japan, Canada, China, Australia, Turkey, Russian Federation, Saudi Arabia, and Others. Eight markets represent around 81% of the imports of olive and virgin olive oils worldwide, the United States, the European Union, Brazil, Japan, Canada, China, Australia, and Russia.
The United States captured the largest market share due to the rising Consumption of olives oil, less Production, rising urbanization and Globalization, Government favorable regulation in production techniques, and health-conscious consumers driving the growth of the United State Market.
Spain represented the major Exporting Country
By Export, Eu-27 holds the largest market share during the forecast period. The market has been segmented into eleven types such as EU-27, Tunisia, Turkey, Syrian Arab Republic, Morocco, Argentina, Chile, United States, Lebanon, Jordan, and Others.
Spain is the largest olive oil exporter, followed by Greece, Italy, Tunisia, and Portugal in the EU. However, European countries import most of their olive oil from other European countries because the most significant share of intra-European trade consists of bulk olive oil blended by the largest olive oil companies before bottling.
Virgin Olive Oil will continue to grow in the Forecast Period
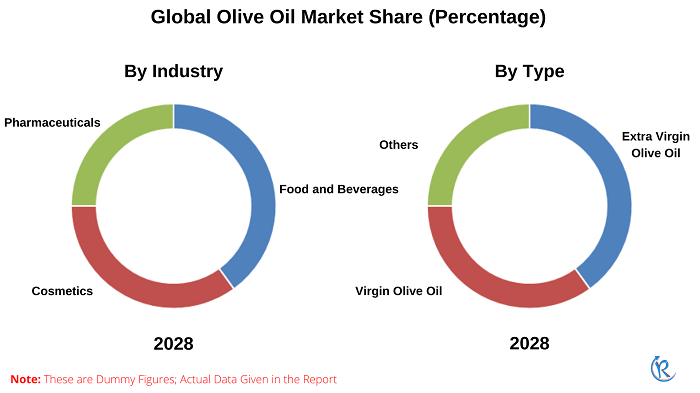
Based on Type, Worldwide Olive Oil Market is ked-up into Extra Virgin Olive Oil, Virgin Olive Oil, and Others. Virgin Olive Oil will dominate the market share due to increasing demand from health-aware consumers, as it is fruity but has some sensory defects. In addition, its acidity shall not exceed 2%. Furthermore, through advanced technology process methods, producers produce more virgin olive oil in the market. As a result, the largest producers of virgin olive oil are China, U.S., Brazil, Germany, and Mexico.
Food & Beverage Industry will capture more Share in Upcoming Years
Based on Industry, Food and Beverages dominated the largest market share during the forecast period because of the wide range of brand popularity of olive oil available in the market, creating more demand for consumers in the food and beverages industry. In addition, consumers' desire for a healthy lifestyle has increased the demand for olive oil in various food items. Therefore, the market is bifurcated into Food and Beverages, cosmetics, and Pharmaceuticals. Pharmaceuticals segment also holds a significant share as medicine. People commonly use olive oil for heart disease, diabetes, and high blood pressure.
Key Development
The primary key players covered in the report are Modi Naturals, Cargill, Inc., Bunge Limited, Conagra Brands, and Semapa.
- In Feb, 2022, Olio Nuovo Extra Virgin Olive Oil, a batch released by Curation Foods, Inc. under the name Of Olive Oil & Vinegars, is seasonal oil with a flavor that is both fresh and powerful.
BY Type: – Market will be divided into three types
1. Extra Virgin Olive Oil
2. Virgin Olive Oil
3. Others
By Industry: – Market will be divided into three types
1. Food and Beverages
2. Cosmetics
3. Pharmaceuticals
End-User: – Market will be divided into three types
1. Food Service
2. Food Processing
3. Retail
Consumption: – Market will be divided into eleven types
1. EU-27
2. Turkey
3. Morocco
4. Tunisia
5. Syrian Arab Republic
6. Algeria
7. Argentina
8. Lebanon
9. Jordan
10. Chile
11. Others
Production: – Market will be divided into eleven types
1. EU-27
2. Turkey
3. Morocco
4. Tunisia
5. Syrian Arab Republic
6. Algeria
7. Argentina
8. Lebanon
9. Jordan
10. Chile
11. Others
Import: – Market will be divided into eleven types
1. United States
2. EU-27
3. Brazil
4. Japan
5. Canada
6. China
7. Australia
8. Turkey
9. Russian Federation
10. Saudi Arabia
11. Others
Export: – Market will be divided into eleven types
1. EU-27
2. Tunisia
3. Turkey
4. Syrian Arab Republic
5. Morocco
6. Argentina
7. Chile
8. United States
9. Lebanon
10. Jordan
11. Others
All key players have been covered from 3 viewpoints
1. Overviews
2. Recent Developments
3. Revenues
Company Analysis
1. Cargill Inc.
2. Modi Naturals
3. Ingredient
4. Bunge Limited
5. Conagra Brands
6. Semapa
Report Details:
| Report Features | Details |
| Base Year | 2022 |
| Historical Period | 2018 - 2022 |
| Forecast Period | 2023 - 2027 |
| Market | US$ Billion |
| Segment Covered | Type, Industry, End Use, Consumption, Production, Import, and Export |
| Companies Covered | Modi Naturals, Cargill, Inc., Bunge Limited, Conagra Brands, and Semapa |
| Customization Scope | 20% Free Customization |
| Post-Sale Analyst Support | 1 Year (52 Weeks) |
| Delivery Format | PDF and Excel through Email (We can also provide the editable version of the report in PPT/Word format on request) |
Frequently Asked Questions (FAQ):
1. How big is the Global Olive Oil Market?
2. What will drive the market size of the Global Olive Oil Market?
3. How did the ongoing coronavirus (COVID-19) pandemic impact the growth?
4. Which segment holds the largest market share?
5. How will the Global Olive Oil Market perform in 2028?
1. Introduction
2. Research & Methodology
3. Executive Summary
4. Market Dynamics
4.1 Growth Drivers
4.2 Challenge
5. Global Olive Oil Market
6. Volume Analysis - Global Olive Oil Market
6.1 By Consumption
6.2 By Production
6.3 By Import
6.4 By Export
7. Market Share - Global Olive Oil Market
7.1 By Type
7.2 By Industry
8. Consuming countries- Global Olive Oil Market and Volume
8.1 EU-27
8.1.1 Market
8.1.2 Volume
8.2 United States
8.2.1 Market
8.2.2 Volume
8.3 Turkey
8.3.1 Market
8.3.2 Volume
8.4 Morocco
8.4.1 Market
8.4.2 Volume
8.5 Algeria
8.5.1 Market
8.5.2 Volume
8.6 United Kingdom
8.6.1 Market
8.6.2 Volume
8.7 Brazil
8.7.1 Market
8.7.2 Volume
8.8 Japan
8.8.1 Market
8.8.2 Volume
8.9 Syrian Arab
8.9.1 Market
8.9.2 Volume
8.10 Australia
8.10.1 Market
8.10.2 Volume
8.11 Others
8.11.1 Market
8.11.2 Volume
9. Producing Countries – Global Olive Oil Volume
9.1 EU-27
9.2 Turkey
9.3 Tunisia
9.4 Morocco
9.5 Syrian Arab
9.6 Algeria
9.7 Argentina
9.8 Lebanon
9.9 Jordan
9.10 Chile
9.11 Others
10. Importing countries – Global Olive Oil Volume
10.1 United States
10.2 EU-27
10.3 United Kingdom
10.4 Brazil
10.5 Japan
10.6 China
10.7 Canada
10.8 Australia
10.9 Saudi Arabia
10.10 Turkey
10.11 Others
11. Exporting countries- Global Olive Oil Volume
11.1 EU-27
11.2 Tunisia
11.3 Syrian Arab
11.4 Turkey
11.5 Morocco
11.6 Argentina
11.7 Chile
11.8 United States
11.9 Lebanon
11.10 Australia
11.11 Others
12. Type- Global Olive Oil Market
12.1 Extra Virgin Olive Oil
12.2 Virgin Olive Oil
12.3 Others
13. Industry- Global Olive Oil Market
13.1 Food and beverages
13.2 Cosmetics
13.3 Pharmaceuticals
14. Key Players Analysis
14.1 Cargill Inc.
14.1.1 Business Overview
14.1.2 Sales Analysis
14.1.3 Recent Development
14.2 Modi Naturals
14.2.1 Business Overview
14.2.2 Sales Analysis
14.2.3 Recent Development
14.3 Bunge Limited
14.3.1 Business Overview
14.3.2 Sales Analysis
14.3.3 Recent Development
14.4 Conagra Brands (Bertolli®)
14.4.1 Business Overview
14.4.2 Sales Analysis
14.4.3 Recent Development
14.5 Semapa
14.5.1 Business Overview
14.5.2 Sales Analysis
14.5.3 Recent Development
List of Figures:
Figure-01: Global – Olive Oil Market (Billion US$), 2018 – 2022
Figure-02: Global – Forecast for Olive Oil Market (Billion US$), 2023 – 2028
Figure-03: EU-27 – Olive Oil Consumption Market (Million US$), 2018 – 2022
Figure-04: EU-27 – Forecast for Olive Oil Consumption Market (Million US$), 2023 – 2028
Figure-05: EU-27 – Olive Oil Consumption Volume (1000 Metric Tons), 2018 – 2022
Figure-06: EU-27 – Forecast for Olive Oil Consumption Volume (1000 Metric Tons), 2023 – 2028
Figure-07: United States – Olive Oil Consumption Market (Million US$), 2018 – 2022
Figure-08: United States – Forecast for Olive Oil Consumption Market (Million US$), 2023 – 2028
Figure-09: United States – Olive Oil Consumption Volume (1000 Metric Tons), 2018 – 2022
Figure-10: United States – Forecast for Olive Oil Consumption Volume (1000 Metric Tons), 2023 – 2028
Figure-11: Turkey – Olive Oil Consumption Market (Million US$), 2018 – 2022
Figure-12: Turkey – Forecast for Olive Oil Consumption Market (Million US$), 2023 – 2028
Figure-13: Turkey – Olive Oil Consumption Volume (1000 Metric Tons), 2018 – 2022
Figure-14: Turkey – Forecast for Olive Oil Consumption Volume (1000 Metric Tons), 2023 – 2028
Figure-15: Morocco – Olive Oil Consumption Market (Million US$), 2018 – 2022
Figure-16: Morocco – Forecast for Olive Oil Consumption Market (Million US$), 2023 – 2028
Figure-17: Morocco – Olive Oil Consumption Volume (1000 Metric Tons), 2018 – 2022
Figure-18: Morocco – Forecast for Olive Oil Consumption Volume (1000 Metric Tons), 2023 – 2028
Figure-19: Algeria – Olive Oil Consumption Market (Million US$), 2018 – 2022
Figure-20: Algeria – Forecast for Olive Oil Consumption Market (Million US$), 2023 – 2028
Figure-21: Algeria – Olive Oil Consumption Volume (1000 Metric Tons), 2018 – 2022
Figure-22: Algeria – Forecast for Olive Oil Consumption Volume (1000 Metric Tons), 2023 – 2028
Figure-23: United Kingdom – Olive Oil Consumption Market (Million US$), 2018 – 2022
Figure-24: United Kingdom – Forecast for Olive Oil Consumption Market (Million US$), 2023 – 2028
Figure-25: United Kingdom – Olive Oil Consumption Volume (1000 Metric Tons), 2018 – 2022
Figure-26: United Kingdom – Forecast for Olive Oil Consumption Volume (1000 Metric Tons), 2023 – 2028
Figure-27: Brazil – Olive Oil Consumption Market (Million US$), 2018 – 2022
Figure-28: Brazil – Forecast for Olive Oil Consumption Market (Million US$), 2023 – 2028
Figure-29: Brazil – Olive Oil Consumption Volume (1000 Metric Tons), 2018 – 2022
Figure-30: Brazil – Forecast for Olive Oil Consumption Volume (1000 Metric Tons), 2023 – 2028
Figure-31: Japan – Olive Oil Consumption Market (Million US$), 2018 – 2022
Figure-32: Japan – Forecast for Olive Oil Consumption Market (Million US$), 2023 – 2028
Figure-33: Japan – Olive Oil Consumption Volume (1000 Metric Tons), 2018 – 2022
Figure-34: Japan – Forecast for Olive Oil Consumption Volume (1000 Metric Tons), 2023 – 2028
Figure-35: Syrian Arab – Olive Oil Consumption Market (Million US$), 2018 – 2022
Figure-36: Syrian Arab – Forecast for Olive Oil Consumption Market (Million US$), 2023 – 2028
Figure-37: Syrian Arab – Olive Oil Consumption Volume (1000 Metric Tons), 2018 – 2022
Figure-38: Syrian Arab – Forecast for Olive Oil Consumption Volume (1000 Metric Tons), 2023 – 2028
Figure-39: Australia – Olive Oil Consumption Market (Million US$), 2018 – 2022
Figure-40: Australia – Forecast for Olive Oil Consumption Market (Million US$), 2023 – 2028
Figure-41: Australia – Olive Oil Consumption Volume (1000 Metric Tons), 2018 – 2022
Figure-42: Australia – Forecast for Olive Oil Consumption Volume (1000 Metric Tons), 2023 – 2028
Figure-43: Others – Olive Oil Consumption Market (Million US$), 2018 – 2022
Figure-44: Others – Forecast for Olive Oil Consumption Market (Million US$), 2023 – 2028
Figure-45: Others – Olive Oil Consumption Volume (1000 Metric Tons), 2018 – 2022
Figure-46: Others – Forecast for Olive Oil Consumption Volume (1000 Metric Tons), 2023 – 2028
Figure-47: EU-27 – Olive Oil Production Volume (1000 Metric Tons), 2018 – 2022
Figure-48: EU-27 – Forecast for Olive Oil Production Volume (1000 Metric Tons), 2023 – 2028
Figure-49: Turkey – Olive Oil Production Volume (1000 Metric Tons), 2018 – 2022
Figure-50: Turkey – Forecast for Olive Oil Production Volume (1000 Metric Tons), 2023 – 2028
Figure-51: Tunisia – Olive Oil Production Volume (1000 Metric Tons), 2018 – 2022
Figure-52: Tunisia – Forecast for Olive Oil Production Volume (1000 Metric Tons), 2023 – 2028
Figure-53: Morocco – Olive Oil Production Volume (1000 Metric Tons), 2018 – 2022
Figure-54: Morocco – Forecast for Olive Oil Production Volume (1000 Metric Tons), 2023 – 2028
Figure-55: Syrian Arab – Olive Oil Production Volume (1000 Metric Tons), 2018 – 2022
Figure-56: Syrian Arab – Forecast for Olive Oil Production Volume (1000 Metric Tons), 2023 – 2028
Figure-57: Algeria – Olive Oil Production Volume (1000 Metric Tons), 2018 – 2022
Figure-58: Algeria – Forecast for Olive Oil Production Volume (1000 Metric Tons), 2023 – 2028
Figure-59: Argentina – Olive Oil Production Volume (1000 Metric Tons), 2018 – 2022
Figure-60: Argentina – Forecast for Olive Oil Production Volume (1000 Metric Tons), 2023 – 2028
Figure-61: Lebanon – Olive Oil Production Volume (1000 Metric Tons), 2018 – 2022
Figure-62: Lebanon – Forecast for Olive Oil Production Volume (1000 Metric Tons), 2023 – 2028
Figure-63: Jordan – Olive Oil Production Volume (1000 Metric Tons), 2018 – 2022
Figure-64: Jordan – Forecast for Olive Oil Production Volume (1000 Metric Tons), 2023 – 2028
Figure-65: Chile – Olive Oil Production Volume (1000 Metric Tons), 2018 – 2022
Figure-66: Chile – Forecast for Olive Oil Production Volume (1000 Metric Tons), 2023 – 2028
Figure-67: Others – Olive Oil Production Volume (1000 Metric Tons), 2018 – 2022
Figure-68: Others – Forecast for Olive Oil Production Volume (1000 Metric Tons), 2023 – 2028
Figure-69: United States – Olive Oil Import Volume (1000 Metric Tons), 2018 – 2022
Figure-70: United States – Forecast for Olive Oil Import Volume (1000 Metric Tons), 2023 – 2028
Figure-71: EU-27 – Olive Oil Import Volume (1000 Metric Tons), 2018 – 2022
Figure-72: EU-27 – Forecast for Olive Oil Import Volume (1000 Metric Tons), 2023 – 2028
Figure-73: United Kingdom – Olive Oil Import Volume (1000 Metric Tons), 2018 – 2022
Figure-74: United Kingdom – Forecast for Olive Oil Import Volume (1000 Metric Tons), 2023 – 2028
Figure-75: Brazil – Olive Oil Import Volume (1000 Metric Tons), 2018 – 2022
Figure-76: Brazil – Forecast for Olive Oil Import Volume (1000 Metric Tons), 2023 – 2028
Figure-77: Japan – Olive Oil Import Volume (1000 Metric Tons), 2018 – 2022
Figure-78: Japan – Forecast for Olive Oil Import Volume (1000 Metric Tons), 2023 – 2028
Figure-79: China – Olive Oil Import Volume (1000 Metric Tons), 2018 – 2022
Figure-80: China – Forecast for Olive Oil Import Volume (1000 Metric Tons), 2023 – 2028
Figure-81: Canada – Olive Oil Import Volume (1000 Metric Tons), 2018 – 2022
Figure-82: Canada – Forecast for Olive Oil Import Volume (1000 Metric Tons), 2023 – 2028
Figure-83: Australia – Olive Oil Import Volume (1000 Metric Tons), 2018 – 2022
Figure-84: Australia – Forecast for Olive Oil Import Volume (1000 Metric Tons), 2023 – 2028
Figure-85: Saudi Arabia – Olive Oil Import Volume (1000 Metric Tons), 2018 – 2022
Figure-86: Saudi Arabia – Forecast for Olive Oil Import Volume (1000 Metric Tons), 2023 – 2028
Figure-87: Turkey – Olive Oil Import Volume (1000 Metric Tons), 2018 – 2022
Figure-88: Turkey – Forecast for Olive Oil Import Volume (1000 Metric Tons), 2023 – 2028
Figure-89: Others – Olive Oil Import Volume (1000 Metric Tons), 2018 – 2022
Figure-90: Others – Forecast for Olive Oil Import Volume (1000 Metric Tons), 2023 – 2028
Figure-91: EU-27 – Olive Oil Export Volume (1000 Metric Tons), 2018 – 2022
Figure-92: EU-27 – Forecast for Olive Oil Export Volume (1000 Metric Tons), 2023 – 2028
Figure-93: Tunisia – Olive Oil Export Volume (1000 Metric Tons), 2018 – 2022
Figure-94: Tunisia – Forecast for Olive Oil Export Volume (1000 Metric Tons), 2023 – 2028
Figure-95: Syrian Arab – Olive Oil Export Volume (1000 Metric Tons), 2018 – 2022
Figure-96: Syrian Arab – Forecast for Olive Oil Export Volume (1000 Metric Tons), 2023 – 2028
Figure-97: Turkey – Olive Oil Export Volume (1000 Metric Tons), 2018 – 2022
Figure-98: Turkey – Forecast for Olive Oil Export Volume (1000 Metric Tons), 2023 – 2028
Figure-99: Morocco – Olive Oil Export Volume (1000 Metric Tons), 2018 – 2022
Figure-100: Morocco – Forecast for Olive Oil Export Volume (1000 Metric Tons), 2023 – 2028
Figure-101: Argentina – Olive Oil Export Volume (1000 Metric Tons), 2018 – 2022
Figure-102: Argentina – Forecast for Olive Oil Export Volume (1000 Metric Tons), 2023 – 2028
Figure-103: Chile – Olive Oil Export Volume (1000 Metric Tons), 2018 – 2022
Figure-104: Chile – Forecast for Olive Oil Export Volume (1000 Metric Tons), 2023 – 2028
Figure-105: United States – Olive Oil Export Volume (1000 Metric Tons), 2018 – 2022
Figure-106: United States – Forecast for Olive Oil Export Volume (1000 Metric Tons), 2023 – 2028
Figure-107: Lebanon – Olive Oil Export Volume (1000 Metric Tons), 2018 – 2022
Figure-108: Lebanon – Forecast for Olive Oil Export Volume (1000 Metric Tons), 2023 – 2028
Figure-109: Australia – Olive Oil Export Volume (1000 Metric Tons), 2018 – 2022
Figure-110: Australia – Forecast for Olive Oil Export Volume (1000 Metric Tons), 2023 – 2028
Figure-111: Others – Olive Oil Export Volume (1000 Metric Tons), 2018 – 2022
Figure-112: Others – Forecast for Olive Oil Export Volume (1000 Metric Tons), 2023 – 2028
Figure-113: Type – Extra Virgin Olive Oil Market (Billion US$), 2018 – 2022
Figure-114: Type – Forecast for Extra Virgin Olive Oil Market (Billion US$), 2023 – 2028
Figure-115: Type – Virgin Olive Oil Market (Billion US$), 2018 – 2022
Figure-116: Type – Forecast for Virgin Olive Oil Market (Billion US$), 2023 – 2028
Figure-117: Type – Others Market (Billion US$), 2018 – 2022
Figure-118: Type – Forecast for Others Market (Billion US$), 2023 – 2028
Figure-119: Industry – Food and beverages Market (Billion US$), 2018 – 2022
Figure-120: Industry – Forecast for Food and beverages Market (Billion US$), 2023 – 2028
Figure-121: Industry – Cosmetics Market (Billion US$), 2018 – 2022
Figure-122: Industry – Forecast for Cosmetics Market (Billion US$), 2023 – 2028
Figure-123: Industry – Pharmaceuticals Market (Billion US$), 2018 – 2022
Figure-124: Industry – Forecast for Pharmaceuticals Market (Billion US$), 2023 – 2028
Figure-125: Cargill Inc. – Global Revenue (Billion US$), 2018 – 2022
Figure-126: Cargill Inc. – Forecast for Global Revenue (Billion US$), 2023 – 2028
Figure-127: Modi Naturals – Global Revenue (Billion US$), 2018 – 2022
Figure-128: Modi Naturals – Forecast for Global Revenue (Billion US$), 2023 – 2028
Figure-129: Bunge Limited – Global Revenue (Billion US$), 2018 – 2022
Figure-130: Bunge Limited – Forecast for Global Revenue (Billion US$), 2023 – 2028
Figure-131: Conagra Brands (Bertolli®) – Global Revenue (Billion US$), 2018 – 2022
Figure-132: Conagra Brands (Bertolli®) – Forecast for Global Revenue (Billion US$), 2023 – 2028
Figure-133: Semapa – Global Revenue (Billion US$), 2018 – 2022
Figure-134: Semapa – Forecast for Global Revenue (Billion US$), 2023 – 2028
List of Tables:
Table-01: Global – Olive Oil Volume Share by Consuming Countries (Percent), 2018 – 2022
Table-02: Global – Forecast for Olive Oil Volume Share by Consuming Countries (Percent), 2023 – 2028
Table-03: Global – Olive Oil Volume Share by Producing Countries (Percent), 2018 – 2022
Table-04: Global – Forecast for Olive Oil Volume Share by Producing Countries (Percent), 2023 – 2028
Table-05: Global – Olive Oil Volume Share by Importing Countries (Percent), 2018 – 2022
Table-06: Global – Forecast for Olive Oil Volume Share by Importing Countries (Percent), 2023 – 2028
Table-07: Global – Olive Oil Volume Share by Exporting Countries (Percent), 2018 – 2022
Table-08: Global – Forecast for Olive Oil Volume Share by Exporting Countries (Percent), 2023 – 2028
Table-09: Global – Olive Oil Market Share by Type (Percent), 2018 – 2022
Table-10: Global – Forecast for Olive Oil Market Share by Type (Percent), 2023 – 2028
Table-11: Global – Olive Oil Market Share by Industry (Percent), 2018 – 2022
Table-12: Global – Forecast for Olive Oil Market Share by Industry (Percent), 2023 – 2028
Reach out to us
Call us on
USA: +1-678-302-0700
INDIA: +91-120-421-9822
Drop us an email at
info@renub.com