Misc
A Network Map of the World’s Air Traffic Connections
View a high resolution version of this graphic
A Network Map of the World’s Air Traffic Connections
View the high resolution version of today’s graphic by clicking here.
In 2017, airlines moved over four billion passengers, a number that continues to grow each year.
As more and more people around the world can afford to scratch their travel itch, new connections and airports will be created to meet that demand. Remarkably, the world’s air transport network doubles in size every 15 years, and the International Civil Aviation Organisation (ICAO) estimates that it will do so again by the year 2030.
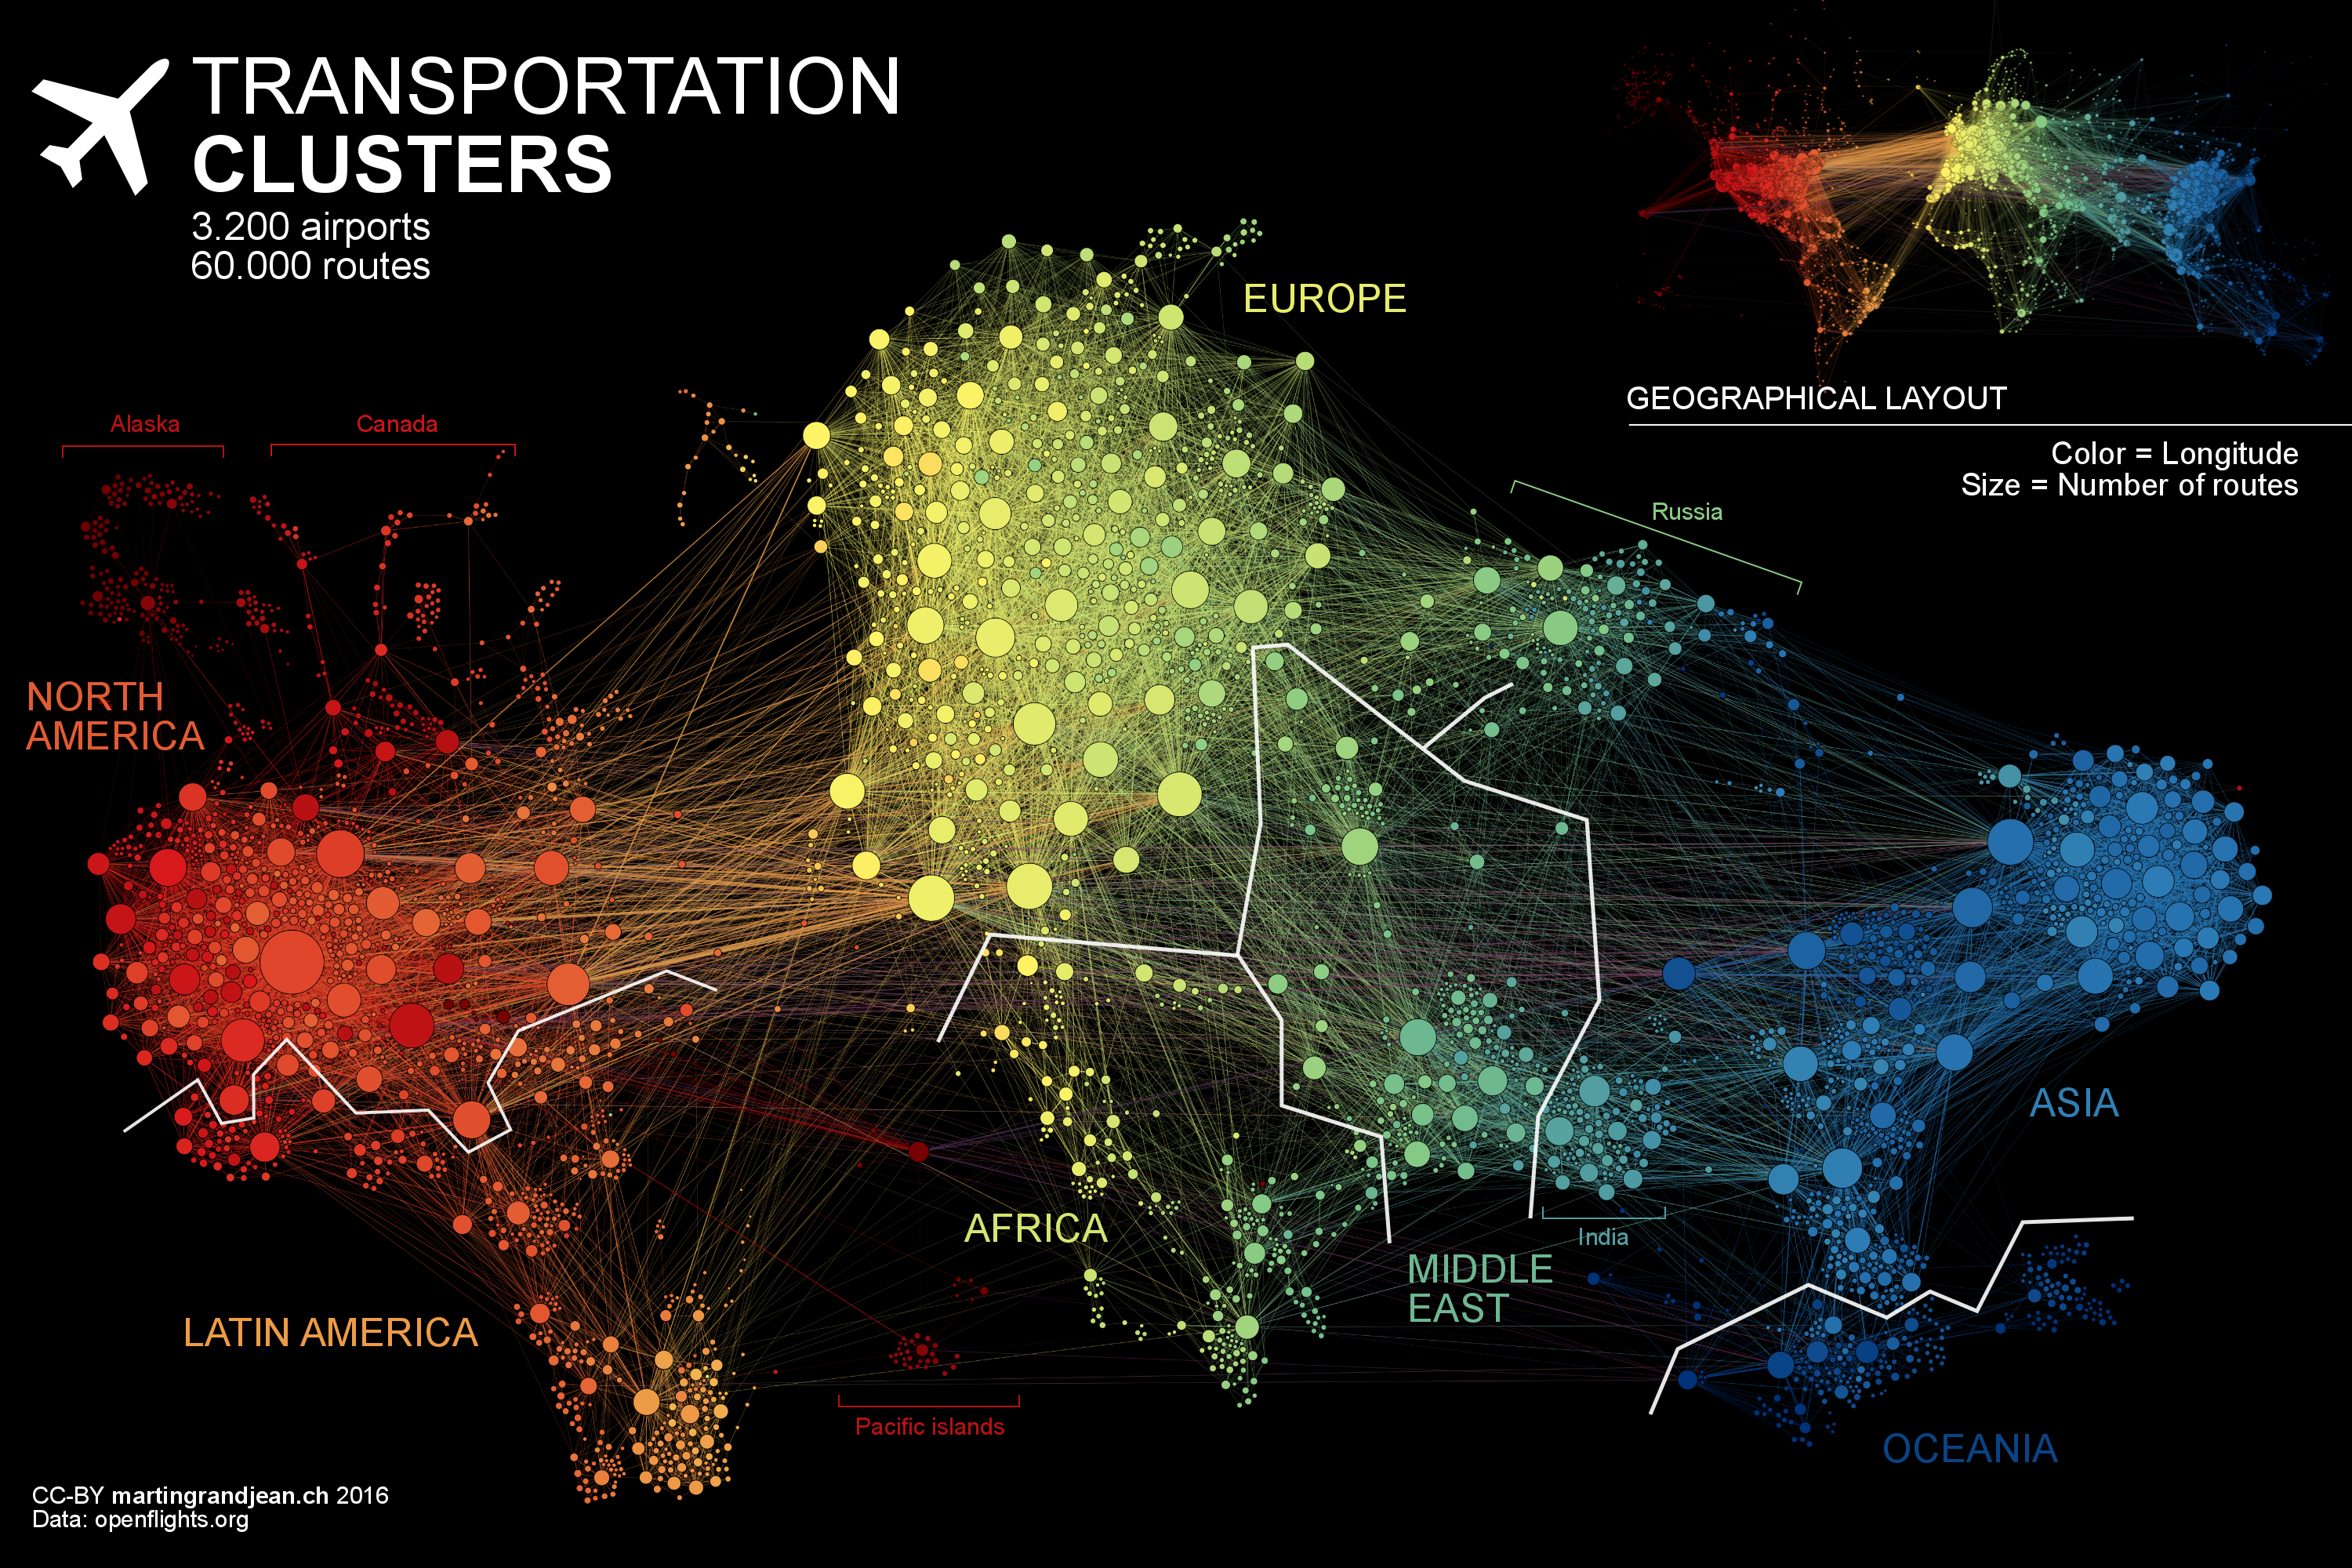
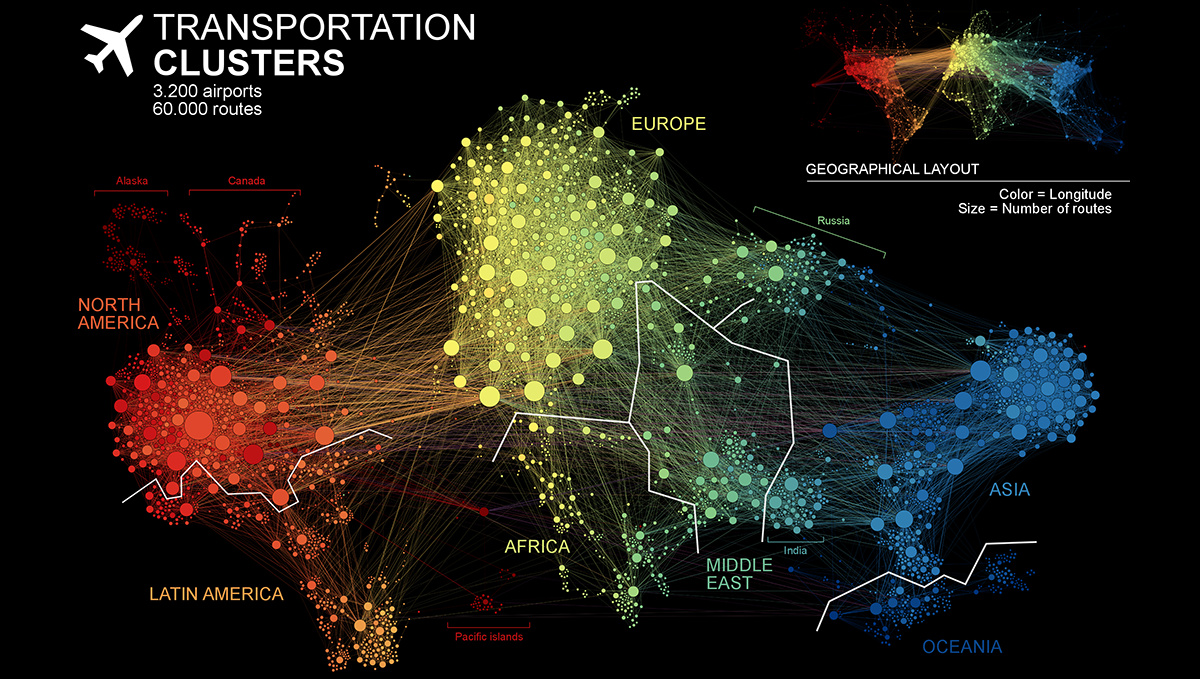
Today’s data visualization – created by researcher, Martin Grandjean – is a dramatic look at over 3,200 air traffic hubs that connect our world’s population centers. The unique, force-directed layout allows us to see relationships beyond geographical location.
As the GIF above reveals, Europe remains an important linchpin in international travel, and cities on North America’s West Coast – such as Vancouver and San Francisco – swing in response to Asia’s gravitational pull.
The World’s Most Connected Airports
While all airports are effective at moving passengers from point A to B, particular locations play a crucial role in the global network. To help put this connectivity between airports into perspective, OAG created the Megahubs International Index.
Below are the top 50 internationally connected airports:
| Rank | Airport | Airport Name | Country | Connectivity Index |
|---|---|---|---|---|
| 1 | LHR | Heathrow | United Kingdom | 379 |
| 2 | FRA | Frankfurt | Germany | 307 |
| 3 | AMS | Amsterdam Schiphol | Netherlands | 299 |
| 4 | ORD | O'Hare | United States | 295 |
| 5 | YYZ | Toronto Pearson | Canada | 271 |
| 6 | SIN | Singapore Changi | Singapore | 257 |
| 7 | CGK | Soekarno–Hatta | Indonesia | 256 |
| 8 | ATL | Hartsfield–Jackson | United States | 256 |
| 9 | KUL | Kuala Lumpur | Malaysia | 242 |
| 10 | CDG | Charles de Gaulle | France | 242 |
| 11 | LAX | Los Angeles | United States | 235 |
| 12 | HKG | Hong Kong | Hong Kong | 233 |
| 13 | BKK | Suvarnabhumi | Thailand | 226 |
| 14 | MUC | Munich | Germany | 221 |
| 15 | IST | Istanbul Atatürk | Turkey | 219 |
| 16 | MIA | Miami | United States | 204 |
| 17 | ICN | Incheon | South Korea | 196 |
| 18 | JFK | John F. Kennedy | United States | 195 |
| 19 | IAH | George Bush | United States | 184 |
| 20 | DXB | Dubai | United Arab Emirates | 183 |
| 21 | MEX | Mexico City | Mexico | 176 |
| 22 | EWR | Newark Liberty | United States | 170 |
| 23 | PVG | Shanghai Pudong | China | 167 |
| 24 | SYD | Sydney | Australia | 167 |
| 25 | DEL | Indira Gandhi | India | 166 |
| 26 | YVR | Vancouver | Canada | 165 |
| 27 | DFW | Dallas/Fort Worth | United States | 164 |
| 28 | HND | Haneda | Japan | 163 |
| 29 | SFO | San Francisco | United States | 153 |
| 30 | FCO | Rome Fiumicino | Italy | 145 |
| 31 | PEK | Beijing Capital | China | 142 |
| 32 | CAN | Guangzhou Baiyun | China | 141 |
| 33 | BOM | Chhatrapati Shivaji | India | 140 |
| 34 | MAD | Madrid–Barajas | Spain | 138 |
| 35 | NCE | Nice Côte d'Azur | France | 133 |
| 36 | JNB | O. R. Tambo | South Africa | 133 |
| 37 | NRT | Narita | Japan | 132 |
| 38 | MNL | Ninoy Aquino | Philippines | 131 |
| 39 | SEA | Seattle–Tacoma | United States | 130 |
| 40 | BOS | Logan | United States | 128 |
| 41 | BOG | El Dorado | Colombia | 127 |
| 42 | GRU | São Paulo–Guarulhos | Brazil | 120 |
| 43 | YUL | Montréal–Trudeau | Canada | 118 |
| 44 | ZRH | Zurich | Switzerland | 115 |
| 45 | SVO | Sheremetyevo | Russian Fed. | 114 |
| 46 | SJU | Luis Muñoz Marín | Puerto Rico | 114 |
| 47 | PTY | Tocumen | Panama | 108 |
| 48 | VIE | Vienna | Austria | 107 |
| 49 | MCO | Orlando | United States | 107 |
| 50 | AKL | Auckland | New Zealand | 106 |
The heavyweight airport leading the world in international connectivity is London Heathrow. This busy air traffic hub recently had a mind-blowing 72,000 possible international connections within a 6-hour window of arriving and departing flights. Heathrow moved over 78 million passengers and 1.70 million metric tonnes of cargo in 2017.
According to OAG, Singapore Changi and El Dorado International Airport in Colombia were the most connected airports in Asia–Pacific and South America, respectively. O. R. Tambo International Airport near Johannesburg was the sole African airport to crack the top 50.
America’s Most Connected Airports
Below are the top 25 most connected airports in the United States:
| Rank | Airport | Airport Name | City | Connectivity Index |
|---|---|---|---|---|
| 1 | ORD | O'Hare | Chicago | 455 |
| 2 | ATL | Hartsfield–Jackson Atlanta | Atlanta | 390 |
| 3 | CLT | Charlotte Douglas | Charlotte | 238 |
| 4 | DFW | Dallas/Fort Worth | Dallas | 207 |
| 5 | DEN | Denver | Denver | 186 |
| 6 | DTW | Detroit Metro. Wayne County | Detroit | 139 |
| 7 | MSP | Minneapolis–Saint Paul | Minneapolis–St. Paul | 126 |
| 8 | LAX | Los Angeles | Los Angeles | 114 |
| 9 | HNL | Daniel K. Inouye | Honolulu | 104 |
| 10 | PHX | Phoenix Sky Harbor | Phoenix | 103 |
| 11 | IAH | George Bush | Houston | 102 |
| 12 | BOS | Boston Logan | Boston | 95 |
| 13 | SEA | Seattle–Tacoma | Seattle | 87 |
| 14 | PHL | Philadelphia | Philadelphia | 85 |
| 15 | SFO | San Francisco | San Francisco | 84 |
| 16 | SLC | Salt Lake City | Salt Lake City | 79 |
| 17 | MDW | Chicago Midway | Chicago | 75 |
| 18 | DCA | Ronald Reagan Washington | Washington | 65 |
| 19 | IAD | Washington Dulles | Washington | 57 |
| 20 | DAL | Dallas Love Field | Dallas | 56 |
| 21 | EWR | Newark Liberty | Newark | 54 |
| 22 | LAS | McCarran | Las Vegas | 54 |
| 23 | BWI | Baltimore–Washington | Baltimore | 53 |
| 24 | LGA | LaGuardia | New York | 51 |
| 25 | STL | St. Louis Lambert | St. Louis | 43 |
While Atlanta Airport, the second most connected hub, has more scheduled domestic capacity, O’Hare’s scheduling offered more connection possibilities for passengers. Both these powerhouse transport nodes show up very clearly on the network map above.
No Fly Zones
There is a grand total of five countries in the world that have no airport and, interestingly, they’re all in Europe. Vatican City and Monaco are simply too small to accommodate an airport.
The remaining three – Andorra, San Marino, and Liechtenstein – rely on neighboring countries and/or helicopter pads for their air travel needs.


Misc
How Hard Is It to Get Into an Ivy League School?
We detail the admission rates and average annual cost for Ivy League schools, as well as the median SAT scores required to be accepted.


How Hard Is It to Get Into an Ivy League School?
This was originally posted on our Voronoi app. Download the app for free on iOS or Android and discover incredible data-driven charts from a variety of trusted sources.
Ivy League institutions are renowned worldwide for their academic excellence and long-standing traditions. But how hard is it to get into one of the top universities in the U.S.?
In this graphic, we detail the admission rates and average annual cost for Ivy League schools, as well as the median SAT scores required to be accepted. The data comes from the National Center for Education Statistics and was compiled by 24/7 Wall St.
Note that “average annual cost” represents the net price a student pays after subtracting the average value of grants and/or scholarships received.
Harvard is the Most Selective
The SAT is a standardized test commonly used for college admissions in the United States. It’s taken by high school juniors and seniors to assess their readiness for college-level academic work.
When comparing SAT scores, Harvard and Dartmouth are among the most challenging universities to gain admission to. The median SAT scores for their students are 760 for reading and writing and 790 for math. Still, Harvard has half the admission rate (3.2%) compared to Dartmouth (6.4%).
| School | Admission rate (%) | SAT Score: Reading & Writing | SAT Score: Math | Avg Annual Cost* |
|---|---|---|---|---|
| Harvard University | 3.2 | 760 | 790 | $13,259 |
| Columbia University | 3.9 | 750 | 780 | $12,836 |
| Yale University | 4.6 | 760 | 780 | $16,341 |
| Brown University | 5.1 | 760 | 780 | $26,308 |
| Princeton University | 5.7 | 760 | 780 | $11,080 |
| Dartmouth College | 6.4 | 760 | 790 | $33,023 |
| University of Pennsylvania | 6.5 | 750 | 790 | $14,851 |
| Cornell University | 7.5 | 750 | 780 | $29,011 |
*Costs after receiving federal financial aid.
Additionally, Dartmouth has the highest average annual cost at $33,000. Princeton has the lowest at $11,100.
While student debt has surged in the United States in recent years, hitting $1.73 trillion in 2023, the worth of obtaining a degree from any of the schools listed surpasses mere academics. This is evidenced by the substantial incomes earned by former students.
Harvard grads, for example, have the highest average starting salary in the country, at $91,700.

-

 Mining2 weeks ago
Charted: The Value Gap Between the Gold Price and Gold Miners
-

 Real Estate1 week ago
Ranked: The Most Valuable Housing Markets in America
-

 Business1 week ago
Charted: Big Four Market Share by S&P 500 Audits
-

 AI1 week ago
The Stock Performance of U.S. Chipmakers So Far in 2024
-

 Misc1 week ago
Almost Every EV Stock is Down After Q1 2024
-

 Money2 weeks ago
Where Does One U.S. Tax Dollar Go?
-

 Green2 weeks ago
Ranked: Top Countries by Total Forest Loss Since 2001
-

 Real Estate2 weeks ago
Visualizing America’s Shortage of Affordable Homes