Misr J. Ag. Eng., 25(3) - Misr Journal Of Agricultural Engineering ...
Misr J. Ag. Eng., 25(3) - Misr Journal Of Agricultural Engineering ...
Misr J. Ag. Eng., 25(3) - Misr Journal Of Agricultural Engineering ...

Create successful ePaper yourself
Turn your PDF publications into a flip-book with our unique Google optimized e-Paper software.
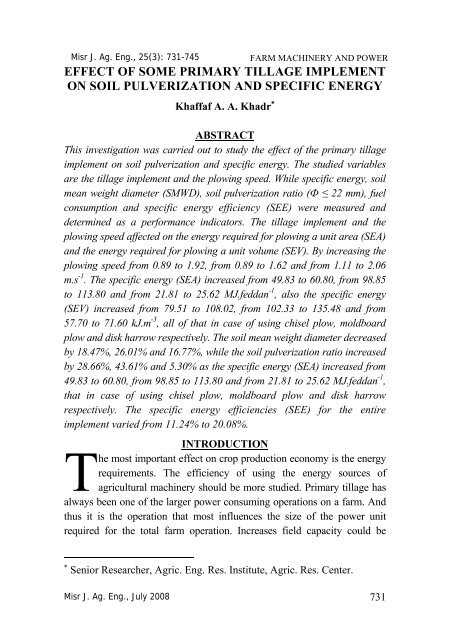
<strong>Misr</strong> J. <strong>Ag</strong>. <strong>Eng</strong>., <strong>25</strong>(3): 731-745<br />
EFFECT OF SOME PRIMARY TILLAGE IMPLEMENT<br />
ON SOIL PULVERIZATION AND SPECIFIC ENERGY<br />
Khaffaf A. A. Khadr <br />
FARM MACHINERY AND POWER<br />
ABSTRACT<br />
This investigation was carried out to study the effect of the primary tillage<br />
implement on soil pulverization and specific energy. The studied variables<br />
are the tillage implement and the plowing speed. While specific energy, soil<br />
mean weight diameter (SMWD), soil pulverization ratio (Ф ≤ 22 mm), fuel<br />
consumption and specific energy efficiency (SEE) were measured and<br />
determined as a performance indicators. The tillage implement and the<br />
plowing speed affected on the energy required for plowing a unit area (SEA)<br />
and the energy required for plowing a unit volume (SEV). By increasing the<br />
plowing speed from 0.89 to 1.92, from 0.89 to 1.62 and from 1.11 to 2.06<br />
m.s -1 . The specific energy (SEA) increased from 49.83 to 60.80, from 98.85<br />
to 113.80 and from 21.81 to <strong>25</strong>.62 MJ.feddan -1 , also the specific energy<br />
(SEV) increased from 79.51 to 108.02, from 102.33 to 135.48 and from<br />
57.70 to 71.60 kJ.m -3 , all of that in case of using chisel plow, moldboard<br />
plow and disk harrow respectively. The soil mean weight diameter decreased<br />
by 18.47%, 26.01% and 16.77%, while the soil pulverization ratio increased<br />
by 28.66%, 43.61% and 5.30% as the specific energy (SEA) increased from<br />
49.83 to 60.80, from 98.85 to 113.80 and from 21.81 to <strong>25</strong>.62 MJ.feddan -1 ,<br />
that in case of using chisel plow, moldboard plow and disk harrow<br />
respectively. The specific energy efficiencies (SEE) for the entire<br />
implement varied from 11.24% to 20.08%.<br />
INTRODUCTION<br />
T<br />
he most important effect on crop production economy is the energy<br />
requirements. The efficiency of using the energy sources of<br />
agricultural machinery should be more studied. Primary tillage has<br />
always been one of the larger power consuming operations on a farm. And<br />
thus it is the operation that most influences the size of the power unit<br />
required for the total farm operation. Increases field capacity could be<br />
Senior Researcher, <strong>Ag</strong>ric. <strong>Eng</strong>. Res. Institute, <strong>Ag</strong>ric. Res. Center.<br />
<strong>Misr</strong> J. <strong>Ag</strong>. <strong>Eng</strong>., July 2008 731
obtained by increasing the machine width or by increasing the plowing<br />
speed. The specific energy may be affected by the field capacity.<br />
Collins et al. (1981) concluded that implement size and speed must be<br />
matched to tractor size. Bukhari and Baloch (1982) reported that the<br />
speed of operation, width of cut, depth of cut, type of soil, and skill of<br />
operator affects on fuel consumption. Bowers (1985) reported that the<br />
normal range for the overall energy efficiency (OEE) is 10 to 20% and this<br />
can be used as a quick check of the validity of fuel consumption<br />
measurements, where Energy is the specific implement energy and fuel is<br />
the fuel consumption under load. A tractor-implement combination having<br />
overall energy efficiency below 10% indicates poor load matching and low<br />
tractive efficiency, while a value above 20% indicates a good load match<br />
and high tractive efficiency. Smith (1993) reported that, the implement<br />
energy would be the energy transferred from the prime mover to the<br />
implement at the hitch point and will be limited to the energy transfer as a<br />
result of work done by draft forces. Within the scope of this definition,<br />
implement energy comparisons were made on the basis of energy required<br />
to operate the implement over an area of one feddan. El-Haddad et al.<br />
(1995) reported that the suitable soil mean weight diameter for seeding is<br />
<strong>25</strong> mm. Khadr et al. (1998) found that the moldboard plow gave a soil<br />
mean weight diameter greater than each of the chisel plow and the rotary<br />
plow.<br />
Al-Janobi and Al-Suhaibani (1998) applied the proposed model by<br />
Harrigan and Rotz (1995) to disk harrows, moldboard plows, disk plows,<br />
and chisel plows in sandy loam soils; they found that the specific drafts<br />
measured were less than those predicted for disk harrow implements. They<br />
attributed the difference to different soil condition, shapes and sizes of the<br />
disk harrow tested. However, specific draft for the moldboard plow and the<br />
chisel plows were very close to the predicted values. Raper et al. (2000)<br />
studied the effect of tillage depth on tillage energy requirement and they<br />
concluded the following points (1) autumn tillage tended to take slightly<br />
less energy and draft than spring tillage and (2) the effect of a winter cover<br />
crop was to slightly increase draft and energy requirements.<br />
Energy requirement and draft force increase with increasing implement<br />
velocity (Al-Jalil et al., 2001). Chandon and Kushwaha (2002) reported<br />
<strong>Misr</strong> J. <strong>Ag</strong>. <strong>Eng</strong>., July 2008 732
that draft and vertical forces increased with an increase in speed. Keller<br />
(2004) reported that, draft force of a tillage implement is a direct measure<br />
of the energy requirement, the draft requirement for pulling a tillage<br />
implement through soil is dependent on implement parameters, tillage<br />
depth, driving speed and soil mechanical strength. Tillage to a depth<br />
greater than 10-15 cm with a chisel plow that has narrow tines without<br />
wings is not recommended. The disk harrow was shown to be energy<br />
efficient for soil fragmentation. The disk harrow had the smallest energy<br />
use for soil fragmentation, this may be attributed to the shallow working<br />
depth, but the moldboard plow is energy efficient for loosing soil<br />
(Arvidsson et. al., 2004).<br />
We could say that the important factor that may affect crop yield is the<br />
detrimental compaction of soil by equipment traffic and tillage<br />
operations. When a farmer suspects yield-limiting compaction,<br />
remediation by tillage is typically considered. Tillage operation is<br />
considered a higher agricultural operation consuming energy, there is a<br />
problem for using the implement with unsuitable tractor, a higher power<br />
tractor more than the implement needed causes many disadvantage such as,<br />
soil compaction due to the tractor weight which affect on water infiltration rate<br />
and root growth, power and specific energy loss. When using a tractor with<br />
small power than the implement needed causes the wheels slippage which<br />
affect on power and specific energy efficiency loss and the tire wearing,<br />
therefore, the current research aimed to:<br />
1- Study the effect of using some tillage implement at different plowing<br />
speed on tillage performance, which helps to select the matched implement<br />
with the tractor.<br />
2- Determine the energy requirements for plowing a unit area (feddan)<br />
and a unit volume (m 3 ) from the soil.<br />
3- Determine the relationship between the plowing speed and the energy<br />
requirements for plowing a unit area (feddan) and a unit volume (m 3 ) from<br />
the soil.<br />
4- Determine the specific energy efficiency (SEE, %) for operating the<br />
tillage implement.<br />
<strong>Misr</strong> J. <strong>Ag</strong>. <strong>Eng</strong>., July 2008 733
EXPERIMENTAL PROCEDURE AND METHODS<br />
This investigation was carried out at Meet El-Deeba Rice Mechanization<br />
center, Kafr El-Sheikh Governorate. The soil is classified as a clay soil,<br />
the average soil bulk density before tilling was 1.15 g/cm 3 , and the<br />
average soil moisture content (d.b) was 19.8%. The studied variables were<br />
tillage implements and plowing speed. While specific energy, soil mean<br />
weight diameter (SMWD), soil pulverization ratio (Ф ≤ 22 mm), fuel<br />
consumption and specific energy efficiency (SEE) were measured and<br />
determined as a performance indicators.<br />
The tractors, implement and instrumentation used in this study were (Dutz<br />
tractor model DX 6.30 (4x4) and (Ford tractor model 6610), 7 shares<br />
chisel plow (the shares are arranged in three rows such that the shares are in<br />
staggered position resulting in a spacing of <strong>25</strong> cm between each<br />
consecutive shares in the three rows), 2 bottom moldboard plow and trailed<br />
disk harrow (its total width of 330 cm, it has four groups of disks, two<br />
groups in front and the others in the rear, the disks in the rear groups are<br />
completed edges, but the groups in front are notched, the average measured<br />
disk’s diameter are 59 cm, the measured distance between each two disks<br />
in each group were 23 cm. The used instrumentation in this study are soil<br />
profile meter, strain gauge dynamometer, Data logger (Daytronic system10),<br />
portable computer, local manufacture fuel meter, stop watches, set of sieves<br />
(100, 75, 50, <strong>25</strong>, 19, 12.5, 6.30, 4.00 and 2.00 mm sieves mesh) and<br />
weighing scale.<br />
Data collection<br />
Speed of operation<br />
The speed was calculated from the time required by the tractor and<br />
implement to cover the distance of five revolutions for the tractor rear tire<br />
through tillage operation, at which the tractor and the machine usually state<br />
speed.<br />
Draft force measurements<br />
Strain gauge dynamometer, 10 ton, Fig. (1.A) was attached with a<br />
horizontal chain between two tractors to measure the draft. Two wheel<br />
drive tractor (Ford model 6610), of 75 hp (55.95 kW) was used as a rear<br />
(towed) on which the implement was mounted; whereas the front tractor<br />
(Dutz DX 6.30 (4x4), 115 hp (85.8 kW) with an engine rated speed of<br />
<strong>Misr</strong> J. <strong>Ag</strong>. <strong>Eng</strong>., July 2008 734
2400 rpm) was used to pull the towed tractor with the attached implement<br />
through the strain gauge dynamometer. The towed tractor was working on<br />
the neutral gear but the implement in the operating position; the draft was<br />
recorded and saved on the portable computer. On the same field the<br />
implement was lifted from the soil and the rear tractor was pulled to<br />
record and save the idle draft. The difference gave the draft of the<br />
implement required to cut and disturb the soil, average draft for each<br />
implement was computed from draft observations through the experiment,<br />
Khadr (2004) used the same instrumentation and the same method.<br />
Width and depth of plowing measurements<br />
The actual width and depth of plowing were measured and determined by<br />
using the soil profile meter; the same instrumentation and the same<br />
method were used by (Khadr, 1990).<br />
Power required for plowing and disturbing the soil<br />
The power could be estimated according to the following formula:<br />
Power = Draft (k N) x plowing speed (m.s -1 ), kW<br />
Fig.(1): Sketch drawing for the strain gauge dynamometer with its wiring and<br />
connections with data logger (Daytronic system 10) and a portable<br />
computer.<br />
Field capacity determination<br />
The field capacity was calculated according the following formula:<br />
Theoretical<br />
-1<br />
Plowing width (m) speed (m.s ) 3.6<br />
field capacity <br />
4.2<br />
-1<br />
feddan.h<br />
Actual field capacity = theoretical field capacity (feddan.h -1 ) x field efficiency (ηf),<br />
%.<br />
<strong>Misr</strong> J. <strong>Ag</strong>. <strong>Eng</strong>., July 2008 735
Field efficiency (ηf, %) varies with type of machine; for tillage machine it<br />
varies from 75 to 85% for moldboard plow and field cultivator ranges from 77 to<br />
90% for disk harrow (John Deere, 1992). The field efficiency is assumed to be<br />
equals 80% for chisel plow, moldboard plow and disk harrow, that to be suitable<br />
for Egyptian field conditions.<br />
Plowed soil volume rate (V) determination<br />
It could be determined according the following formula:<br />
-1<br />
D(m) actual field capacity feddan.h 4.<br />
2 3 -1<br />
V =<br />
m . s<br />
3.<br />
6<br />
Where, V is the plowed soil volume rate, m 3 .s -1 and D is the plowing<br />
depth, m.<br />
Specific energy (SEA and SEV) determination<br />
The specific energy (SEA) was determined by dividing the drawbar<br />
power required for plowing and disturbing the soil per the actual field<br />
capacity (feddan.h -1 ), and also the specific energy (SEV) which is the<br />
energy required for plowing a unit volume from the soil (m 3 ) was<br />
determined by dividing the drawbar power per the plowed soil volume<br />
rate (m 3 .s -1 ). The following formulas were used to determine the specific<br />
energy (SEA and SEV).<br />
Power (kW) 3.6<br />
-1<br />
Specific energy (S.EA) <br />
MJ.feddan<br />
field capacity (feddan.h<br />
-1<br />
)<br />
Power (kW)<br />
Specific energy (S.EV) <br />
kJ.m<br />
-3<br />
Plowed soil volume rate(V), m<br />
3<br />
. s<br />
1<br />
Specific energy efficiency determination (SEE)<br />
The specific energy efficiency (SEE) is the ratio between the specific<br />
energy transferred from the tractor for operating the implement and the<br />
energy equivalent of the fuel consumption required to perform the<br />
operation. This ratio lumps together the performance effects from load<br />
matching between implement and tractor. Specific energy efficiency (SEE)<br />
values for chisel plow, moldboard plow and disk harrow were calculated<br />
according to the following equation:<br />
Assume that the average lower calorific value (LCV) of the fuel = 10 4<br />
Cal.Kg -1<br />
<strong>Misr</strong> J. <strong>Ag</strong>. <strong>Eng</strong>., July 2008 736
4<br />
-3<br />
= [(( 10<br />
MJ/L<br />
Cal/kg) (4.186810<br />
MJ/Cal)) / (Kg ( L./0.84 kg)]<br />
= 35.17<br />
One liter of diesel fuel has energy of 35.17 MJ.<br />
(3.6 MJ / kW.h) Energy, kW.h./ feddan<br />
Specific energy effiency (SEE) <br />
100<br />
(35.17 MJ/ L)<br />
Fuel, L/ feddan<br />
, %<br />
Where, specific energy efficiency (SEE, %) is the specific implement<br />
energy and fuel is the fuel consumption under load.<br />
Soil mean weight diameter determination<br />
The soil mean weight diameter was determined by the same sieves and<br />
the same methods used by Khadr (1997); the following formula was used<br />
for determining the soil mean weight diameter. Set of sieves were used<br />
for determining the soil mean weight diameter (SMWD) by using the<br />
following equation:<br />
n<br />
<br />
i 1<br />
xi W<br />
SMMD <br />
<br />
i<br />
(Van Bavel, 1949)<br />
W<br />
Where: SMWD = the mean weight diameter of soil, mm,<br />
xi = the mean weight diameter of i th fraction<br />
Δ Δ<br />
x i - 1 i mm<br />
i 2<br />
Where: ( Δ sieve mesh ), Wi = the weight of the soil retained on (i th<br />
sieve), and W = the total weight of the soil sample.<br />
Soil pulverization ratio (Ф ≤ 22 mm), %<br />
Soil pulverization ratio is the percentage of the soil weight fraction<br />
composed of soil clods less than or equal 22 mm (Ф ≤ 22 mm) which<br />
passes from the sieve mesh of <strong>25</strong> mm to the total weight of all clods<br />
produced by plowing.<br />
Fuel consumption rate<br />
A local manufacture fuel meter was installed on the front tractor (Dutz DX<br />
6.30) to measure the fuel consumption. The fuel consumption rate (L.h -1 )<br />
was determined with the same method and the same instrumentation used by<br />
Khadr (2004).<br />
<strong>Misr</strong> J. <strong>Ag</strong>. <strong>Eng</strong>., July 2008 737
Statistical analysis<br />
The field data were statistically analyzed, using two-way analysis of<br />
variance (ANOVA) for the randomized complete design with two<br />
replicates. The used software was SAS (1986) using ANOVA procedure.<br />
Comparisons among treatment means, when significant, were conducted<br />
using least significant difference (LSD) at p = 0.05 level.<br />
RESULTS AND DISCUSSION<br />
Results of this investigation were determined with an average value, these<br />
results are summarized in Table (1).This table include performance<br />
indicators (fuel consumption (FC), draft (D), actual field capacity (AFC),<br />
drawbar power (DP), specific energy for unit area (SEA) and specific<br />
energy for soil volume (SEV), soil mean weight diameter (SMWD), soil<br />
pulverization ratio (SP) and specific energy efficiency (SEE)) at different<br />
tillage implements, plowing speed (PS) at certain plowing depth (PD).<br />
Table (1): Average value of performance indicators (fuel consumption<br />
(FC), draft (D), actual field capacity (AFC), drawbar power<br />
(DP), specific energy for unit area (SEA) and specific energy<br />
for soil volume (SEV), soil mean weight diameter (SMWD),<br />
soil pulverization ratio (SP) and specific energy efficiency<br />
(SEE)) at different tillage implements, plowing speed (PS) at<br />
certain plowing depth (PD).<br />
<strong>Misr</strong> J. <strong>Ag</strong>. <strong>Eng</strong>., July 2008 738
Statistical analysis<br />
Tillage implement and plowing speed had significant effect on<br />
performance indicators (fuel consumption, draft, actual field capacity,<br />
drawbar power, specific energy for unit area and specific energy for soil<br />
volume, soil mean weight diameter, and soil pulverization ratio), Table<br />
(2). Meanwhile there is no significant effect on specific energy efficiency<br />
and plowing speed had significant effect on it. The interactions among<br />
treatments had significant effect on all performance indicators, Table (2).<br />
Table (2): Summary of the analysis of variance for the effect of tillage<br />
implements and plowing speed on fuel consumption (FC),<br />
draft (D), actual field capacity (AFC), drawbar power (DP),<br />
specific energy for unit area (SEA) and specific energy for soil<br />
volume (SEV), soil mean weight diameter (SMWD), soil<br />
pulverization ratio (SP) and specific energy efficiency (SEE).<br />
* and ** significant at the 5% and 1% level of probability, respectively<br />
N.S= not significant<br />
Effect of plowing speed on specific energy<br />
As indicated in Table (1), and Figs. (2 and 3), the energy required for<br />
plowing a unit area, SEA (MJ.feddan -1 ) and the energy required for plowing<br />
a unit volume from the soil, SEV (kJ.m -3 ) increase as the plowing speed<br />
increases in case of using chisel plow, moldboard plow and disk harrow<br />
respectively, that may be due to the increase of the soil pulverization which<br />
requires more power from the tractor consequently increases the specific<br />
energy, the determined specific energy (SEA and SEV) values are valid<br />
through the experimental field condition, the plowing speed range and the<br />
tillage implement with its condition. The specific energy (SEA and SEV) in<br />
<strong>Misr</strong> J. <strong>Ag</strong>. <strong>Eng</strong>., July 2008 739
case of using the moldboard plow is higher than that in case of using the<br />
chisel plow and the disk harrow, that may be due to the high operating depth<br />
compared with the chisel plow and the disk harrow, that requires higher<br />
operating power from the tractor, also the operating width of the moldboard<br />
plow is less than that in case of using both of the chisel plow and the disk<br />
harrow which decreases the actual field capacity, thus increases the specific<br />
energy.<br />
Table (3) shows mean values of performance indicators as effect by<br />
tillage implement and plowing speed. However, for fuel consumption, the<br />
moldboard plow had higher fuel consumption compared to other<br />
implements. Also, for specific energy efficiency, there was no significant<br />
among chisel, moldboard and disk harrow and moldboard plow had<br />
higher value, Table (3).<br />
Table (3): Mean fuel consumption (FC), draft (D), actual field capacity<br />
(AFC), drawbar power (DP), specific energy for unit area<br />
(SEA) and specific energy for soil volume (SEV), soil mean<br />
weight diameter (SMWD), soil pulverization ratio (SP) and<br />
specific energy efficiency (SEE) as affected by tillage<br />
implements and plowing speed.<br />
+Means followed by different letters in each column are significantly different at P<br />
= 0.05.<br />
LSD = least significant difference. S = plowing speed<br />
The relationship between the specific energy and both soil mean<br />
weight diameter and soil pulverization ratio<br />
As indicated in Table (1), the soil mean weight diameter (SMWD) has a<br />
reverse relationship with the specific energy for the studied tillage<br />
implements, it decreased by 18.47%, 26.01% and 16.77%, while the soil<br />
<strong>Misr</strong> J. <strong>Ag</strong>. <strong>Eng</strong>., July 2008 740
pulverization ratio increased by 28.66%, 43.61% and 5.30% as the specific<br />
energy (SEA) increased from 49.83 to 60.80, from 98.85 to 113.80 and<br />
from 21.81 to <strong>25</strong>.62 MJ.feddan -1 , that in case of using chisel plow,<br />
moldboard plow and disk harrow respectively. We may say that, the soil<br />
pulverization requires more energy for breaking the soil to small pieces<br />
which decreases the soil mean weight diameter and increases the<br />
pulverization. The energy required for cutting and pulverizing a unit<br />
volume (SEV) from the soil increased with the increase of the plowing<br />
speed, it increased from 79.51 to 108.02, from 102.33 to 135.48 and from<br />
57.70 to 71.60 kJ.m -3 , as the plowing speed increased from 0.89 to 1.92,<br />
from 0.89 to 1.62 and from 1.11 to 2.06 m.s -1 , all of that in case of using<br />
chisel plow, moldboard plow and disk harrow respectively.<br />
Specific energy for unit area (SEA), MJ/fed<br />
150<br />
1<strong>25</strong><br />
100<br />
75<br />
50<br />
<strong>25</strong><br />
0<br />
Chisel Moldboard Disk harrow<br />
y = -35.48x 2 + 110.84x + 28.1<strong>25</strong><br />
R 2 = 0.9124<br />
y = 10.378x + 40.116<br />
R 2 = 0.9403<br />
y = 3.8<strong>25</strong>6x + 17.936<br />
R 2 = 0.9649<br />
0.70 0.90 1.10 1.30 1.50 1.70 1.90 2.10 2.30<br />
Plowing speed, m/s<br />
Fig. (2): Effect of plowing speed on energy required for plowing a soil unit.<br />
Specific energy efficiencies (SEE)<br />
It was noticed that the specific energy efficiencies (SEE) for the implements<br />
as indicated in Table (1) ranged from 11.24% to 20.08%, these values<br />
depends on the tractor condition, tillage implement and condition, the<br />
experimental field type and condition, previous crop and the operating<br />
factors. The maximum specific energy efficiencies (SEE) were 20.08, 15. 48<br />
<strong>Misr</strong> J. <strong>Ag</strong>. <strong>Eng</strong>., July 2008 741
and 17.47% at plowing speeds of 1.92, 1.58 and 2.06 m.s -1 in case of using<br />
chisel plow, moldboard plow and disk harrow respectively, we may say that,<br />
the optimum operating conditions which gave the maximum specific energy<br />
efficiency. The tractor power has a high effect on the specific energy<br />
efficiency. We may say that, the specific energy efficiencies (SEE) is low in<br />
case of using tractors which have a high power compared to the implement<br />
power needed, that may return to excess fuel consumption which increases<br />
the fuel energy consequently decreases the specific energy efficiency. Also<br />
in case of using tractors which have a low power compared to the implement<br />
power needed, the specific energy efficiency (SEE) is low, as increasing the<br />
tractor wheel slippage causes a drawbar power loss, consequently decreases<br />
the specific energy efficiency (SEE). Values of the specific energy efficiency<br />
are valid through the experimental conditions.<br />
Specific energy for soil volume (SEV), KJ/m 3<br />
150<br />
1<strong>25</strong><br />
100<br />
75<br />
50<br />
<strong>25</strong><br />
0<br />
Chisel Moldboard Disk harrow<br />
y = 1.4947x 2 + 36.111x + 69.098<br />
R 2 = 0.9006<br />
y = 13.868x + 42.68<br />
R 2 = 0.9877<br />
y = 27.848x + 53.631<br />
R 2 = 0.9875<br />
0.70 0.90 1.10 1.30 1.50 1.70 1.90 2.10 2.30<br />
Plowing speed, m/s<br />
Fig. (3): Effect of plowing speed on energy required for plowing a soil unit<br />
volume.<br />
CONCLUSION<br />
The following conclusions were made from this study:<br />
- The soil mean weight diameter (SMWD) has a reverse relationship with<br />
the specific energy (SEA), while the soil pulverization ratio (Ф ≤ 22 mm)<br />
increased with the increase of it.<br />
<strong>Misr</strong> J. <strong>Ag</strong>. <strong>Eng</strong>., July 2008 742
- The energy required for cutting and pulverizing a unit volume from the<br />
soil (SEV) increased with the increase of the plowing speed<br />
- The moldboard plow has energy efficient for loosening soil and<br />
therefore, shallow moldboard plowing may be an interesting concept for<br />
reducing energy requirement while maintaining the benefit of a<br />
moldboard plow (e.g. incorporation of crop residues).<br />
- The specific energy efficiency for all tested implements varied from<br />
11.24% to 20.08%. The maximum specific energy efficiencies (SEE)<br />
were at higher plowing speed for chisel plow moldboard plow and disk<br />
harrow.<br />
REFERENCES<br />
Al-Jalil, H.F, A. Khdair and W. Mukahal (2001). Design and performance<br />
of an adjustable three-point hitch dynamometer. Soil & Tillage<br />
Research 62,153-156.<br />
Al-Janobi, A.A. and S.A. Al-Suhaibani (1998). Draft of primary tillage<br />
implements in sandy loam soil. Applied <strong>Eng</strong>ineering in <strong>Ag</strong>riculture<br />
14(4):343– 348.<br />
Arvidsson, J., T. Keller and K. Gustafsson (2004).Specific draft for<br />
moldboard plow, chisel plow and disk harrow at different water<br />
contents. Soil & Tillage Research. Vol. (79):221-231.<br />
Bowers, J. C.G. (1985) Southeastern tillage energy data and<br />
recommended reporting. Transaction of the ASAE, Vol. 28(3):731-<br />
737.<br />
Bukhari, Sh.B. and J.M. Baloch (1982). Fuel consumption of tillage<br />
implements, AMA, Vol. (13): 20-22.<br />
Chandon, K. and R.L. Kushwaha (2002). Soil Forces and Shank Vibration on<br />
Deep Tillage, ASAE Annual International Meeting, Chicago, Illinois,<br />
USA.<br />
Collins, N.E., T.H. Williams, and L.J. Kemble (1981). Measured machine<br />
energy requirements for grain production system. ASAE Publ. 4-81:<br />
407-411.<br />
El-Haddad, Z.A., M.Y. El-Ansary, and M. T.M. Tohamey (1995).<br />
Identifying a proper seedbed preparation system using locally<br />
manufactured machinery. <strong>Misr</strong> J. <strong>Ag</strong>. <strong>Eng</strong>. Vol. 12 (1): 36-45.<br />
<strong>Misr</strong> J. <strong>Ag</strong>. <strong>Eng</strong>., July 2008 743
Harrigan, T.M. and C.A. Rotz (1995). Draft relationships for tillage and<br />
seeding equipment. Applied <strong>Eng</strong>ineering in <strong>Ag</strong>riculture, 11(6):773–<br />
783.<br />
John Deere (1992). Machinery management. Deere & Company service<br />
publications, Dept. FOS/FOM, John Deere road, Moline Illinois<br />
61265-8098; Dpt. Manger: Alton E. Miller. Pp: 28.<br />
Keller, T. (2004). Soil compaction and soil tillage – studies in agricultural soil<br />
mechanics. Ph.D. thesis Swedish University of <strong>Ag</strong>ric. Sciences Uppsala<br />
2004.<br />
Khadr, KH.A.A. (1990). Investigation of some factors affecting the chisel<br />
plough performance, M.Sc., Faculty of <strong>Ag</strong>riculture, Menofeia<br />
University.<br />
Khadr, KH.A.A. (1997). Development of a combination unit for seed-bed<br />
preparation and seeding, Ph.D, Faculty of <strong>Ag</strong>riculture, Mansoura<br />
University.<br />
Khadr, Kh.A.A. (2004). Energy requirements for some seed-bed<br />
preparation implement under Egyptian conditions, the 12 th annual<br />
conference of the “<strong>Misr</strong> Society of <strong>Ag</strong>ricultural <strong>Eng</strong>ineering”, PP:<br />
481-491.<br />
Khadr, Kh.A.A., M.A. El-Saadawy and A.I. Moussa (1998). Investigation<br />
of some tillage methods on soil physical properties and yield<br />
response. <strong>Misr</strong> J. <strong>Ag</strong>. <strong>Eng</strong>. Vol. 15(3): 608-620.<br />
Raper, R.L., D.W. Reeves, C. H. Burmester and E.B. Schwab (2000). Tillage<br />
depth, tillage timing, and cover crop effects on cotton yield, soil strength,<br />
and tillage energy requirements, ASAE Paper No. 98-1112.<br />
SAS (1986). User’s guide, statistical analysis system. SAS Ins., Inc., SAS<br />
Circle, P.O.Box 8000, Cary, N.C.<br />
Smith, L.A. (1993). Energy requirements for selected crop production.<br />
Soil & Tillage Research, Vol. <strong>25</strong>(4): 281– 299.<br />
Van Bavel, A.N. (1949). Mean weight diameter of soil aggregation as<br />
statistical index of aggregation. Soil sc., Soc., Amer., Proc., 14: 20-23.<br />
<strong>Misr</strong> J. <strong>Ag</strong>. <strong>Eng</strong>., July 2008 744
ﻲﺒﺭﻌﻟﺍ ﺹﺨﻠﻤﻟﺍ<br />
" ﺔﻴﻋﻭﻨﻟﺍ ﺔﻗﺎﻁﻟﺍﻭ ﺔﺒﺭﺘﻟﺍ ﺓﺭﺎﺜﺇ ﻲﻠﻋ ﻲﺴﻴﺌﺭﻟﺍ ﺙﺭﺤﻟﺍ ﺕﻻﺁ ﺽﻌﺒ ﺭﻴﺜﺄﺘ"<br />
ﺭــﻀﺨ ﺯﻴﺯﻌﻟﺍﺩﺒﻋ ﻼﻌﻟﺍﻭﺒﺃ ﻑﺎﻔﺨ <br />
ضعب ريثأت ةساردل خيشلا رفك ةظفاحم -ةبيدلا<br />
تيمب زرلأا ةنكيم زكرمب ةيلمعلا براجتلا تيرجأ<br />
ثرحلا ةعرسو<br />
( يصرق طشمو يحرطم بلاق ثارحم ،رافح ثارحم)<br />
يسيئرلا ثرحلا تلاآ<br />
(SEA) ةحاسملا ةدحو ثرحل ةمزلالا ةقاطلا يلع<br />
موجحلا ةدحو ثرحل ةمزلالا ةقاطلا كلذكو<br />
نزو ةبسن)<br />
ةبرتلا تيتفت ةبسنو ،(SMWD)<br />
ةبرتلا ليقلاق رطق طسوتم ،(SEV)<br />
ةبرتلا نم<br />
نزولا يلإ (Ф ≤ 22 mm) يأ مم ٢٢ يواسي وأ نم لقأ اھرطق طسوتم يتلا ةبرتلا ليقلاق<br />
. ( SEE)<br />
ةقاطلل ةيعونلا ةءافكلا ،ةبرتلا ليقلاقل<br />
يلكلا<br />
: يليام جئاتنلا تحضوأ<br />
١-<br />
ث.<br />
م ٢.٠٦ يلإ ١.١١ نمو ،١.٦٢<br />
يلإ ٠.٨٩ نم ،١.٩٢<br />
يلإ ٠.٨٩ نم ثرحلا ةعرس ةدايزب -١<br />
نم ،٦٠.٨٠<br />
يلإ ٤٩.٨٣ نم (SEA) ةحاسملا ةدحو ةراثإو ثرحل ةمزلالا ةقاطلا تداز<br />
١-<br />
ةقاطلا تداز كلذكو ،(<br />
نادف.<br />
لوج اجيم)<br />
٢٥.٦٢ يلإ ٢١.٨١ نمو ،١١٣.٨٠<br />
يلإ ٩٨.٨٥<br />
نم ،١٠٨.٠٢<br />
يلإ ٧٩.٥١ نم (SEV) ةبرتلا نم موجحلا ةدحو ةراثإو ثرحل ةمزلالا<br />
٣-<br />
ثارحملا نم لكل كلذو ( م.<br />
لوج وليك)<br />
٧١.٦٠ يلإ ٥٧.٧٠ نمو ،١٣٥.٤٨<br />
يلإ ١٠٢.٣٣<br />
. بيترتلا يلع يصرقلا طشملاو يحرطملا بلاقلا ثارحملا ،رافحلا<br />
نيب ،١٠٨.٠٢<br />
يلإ ٧٩.٥١ نيب ةبرتلا نم موجحلا ةدحو ةراثإو ثرحل ةمزلالا ةقاطلا حوارتت -٢<br />
٣-<br />
مادختسا دنع كلذو م.<br />
لوجوليك ٧١.٦٠ يلإ ٥٧.٧٠ نيب و ،١٣٥.٤٨<br />
يلإ ١٠٢.٣٣<br />
. يلاوتلا يلع يصرقلا طشملاو يحرطملا بلاقلا ثارحملا ،رافحلا ثارحملا<br />
ةبسن تداز امنيب % ١٦.٧٧ ،%<br />
٢٦.٠١ ،%<br />
١٨.٤٧ لدعمب ةبرتلا ليقلاق رطق طسوتم لق -٣<br />
نم (SEA) ةيعونلا ةقاطلا ةدايزب كلذو % ٥.٣٠ ،%<br />
٤٣.٦١ ،%<br />
٢٨.٦٦ لدعمب ةبرتلا تيتفت<br />
١-<br />
، نادف.<br />
لوجاجيم ٢٥.٦٢ يلإ ٢١.٨١ نمو ،١١٣.٨٠<br />
يلإ ٩٨.٨٥ نم ،٦٠.٨٠<br />
يلإ ٤٩.٨٣<br />
نمو ،١٣٥.٤٨<br />
يلإ ١٠٢.٣٣ نم ،١٠٨.٠٢<br />
يلإ ٧٩.٥١ نم (SEV) ةيعونلا ةقاطلا ةدايزو<br />
٣-<br />
يحرطملا بلاقلا ثارحملا ،رافحلا ثارحملا نم لكل كلذو م.<br />
لوج وليك ٧١.٦٠ يلإ<br />
٥٧.٧٠<br />
. بيترتلا يلع يصرقلا طشملاو<br />
ةدحو ثرحل ةمزلالاو رجلا بيضق يلع ةقاطلا نيب ةبسنلا)<br />
ةقاطلل<br />
ةيعونلا ةءافكلا حوارتت -٤<br />
٠%<br />
٢٠.٠٨ -١١.٢٤<br />
نيب ام ( دوقولا كلاھتسلا ةئفاكملا ةقاطلا يلإ ةحاسملا<br />
. ةيليغشت ةردق نم ةدعملا هبلطتت ام عم بسانتت ةردق تاذ رارج مادختسا بجي -٥<br />
رصم<br />
- ةيعارزلا ثوحبلا زكرم – ةيعارزلا ةسدنھلا ثوحب دھعم – لوأ ثحاب *<br />
<strong>Misr</strong> J. <strong>Ag</strong>. <strong>Eng</strong>., July 2008 745