Now, digital technology and its accompanying capabilities are providing new ways for organizations in the water and wastewater sector and other process industries to face their challenges head-on, simply by using something they already own: their captured sensor data. This data can include information on a range of parameters from water quality to temperature changes, but only by fully leveraging this data does it become truly useful. Luckily, today there are advanced analytics solutions that provide an economical, efficient way to easily achieve this goal.
Analytics trends in industrial water treatment from Endeavor Business Media on Vimeo.
Process Experts Can Do the Analytics Themselves
While there are many treatment plants not yet using data analytics to solve complex process issues, there are many that are. Some of them use their own data scientists while others use external consultancies. The downside to the latter approach is that it is time-consuming and costly for third parties to do extensive data modeling and statistics, and more importantly, there just aren’t enough data scientists for all the work. A more viable and practical solution would be to let the process experts do the analytics themselves. These tools allow the process experts to monitor, analyze and predict treatment processes, giving them a holistic overview of what is going on in the plant.
Advanced analytics uses pattern recognition and machine learning to fully leverage process data. With its capabilities, process experts have “eyes into the processes” and can get data-driven insights. This means they will be able to use the data to solve operational issues and not have to rely only on their experience or instinct to tweak operations to solve problems. Process experts will be able to analyze the data to monitor processes, so they will know exactly what the problem is, and quickly work to solve it. To gain a better understanding of the value of advanced analytics in the water and wastewater and process industries, two use cases will be discussed.
Use Case: Monitoring Pump Operation States
Pumps are, without a doubt, critical assets for the water and wastewater industry and the process industry as a whole. Keeping them in operation is necessary for keeping processes running. A breakdown of an important pump can lead to serious problems, so to avoid an unplanned shutdown, process experts must regularly maintain them. However, not all breakdowns can be avoided since the operation state of a pump is not closely monitored. Process and asset experts often do not have the required tooling or the time to follow-up on every important asset within their responsibilities. An answer to this common operational issue would be to have access to an easy, reproducible and reliable approach to monitor the operation state of important assets.
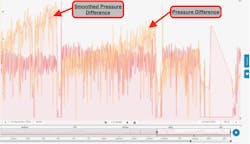
Time series data, which can include information related to pressure difference, vibration, flow rates and shock pulse measurements (SPM) and which are all available for historical analysis, can be used for monitoring purposes. In a recent use case, advanced analytics was used to create an indicator to trigger a monitor. The pressure difference is a good indicator of the pump operation state and therefore can be used as the basis for further analysis and monitoring. In this case, since the pressure difference (yellow trend in Figure 1) had a lot of noise, process experts used an aggregation to smooth out the trend visualized in a new tag (red trend, following the yellow pressure difference). The other red tag displays the flow rate, which is roughly constant during operation. The pressure difference rises throughout its lifecycle until the next maintenance cycle, which can be visually seen as the sudden drops in the flow rates and pressure differences. By knowing this behavior, it is very simple to create a monitor using advanced analytics to inform the process and/or asset experts of the pump status in a timely manner.
Advanced analytics offers easy and fast access to process data, which can be manipulated to create a clear indicator of the pump operation status. The created monitor will enable the process and asset experts to schedule maintenance at the appropriate time before pump failure or before a major process issue occurs. As a result, shutdowns and over-maintenance of the pumps can be avoided, resulting in an overall operation that is more cost efficient.
Use Case: Detecting & Reacting to Pipe Network Anomalies
Referring again to Figure 1 in the first use case, it is noticeable that the flow rate was quite constant in that process. This is not always the case, of course, and makes the analysis of the overall operation state of a pipe network more complex. This next use case brings this complexity to the table. A pipe network is a large-scale system that can cover extensive areas to provide raw material, transport products, or discharge waste to its respective destinations. Detecting and reacting to changes within this network can greatly improve the overall operational excellence. However, to check if there can be improvements, anomalies in the pipe characteristics of this network must be detected.
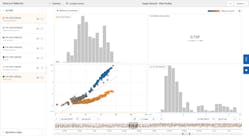
A good and relevant relationship within such a piping network is the behavior between differential pressure and the flow rate. Since only separate pressure measurements were available in this case, the pressure difference had to be calculated using a formula. This created a new calculated tag, which was available for all users for later use. Since data was historically available, it could be brought into a relationship with the corresponding flow rate in the same section. The plot in Figure 2 shows the relationship between the flow rate (X-axis) and differential pressure (Y-axis).
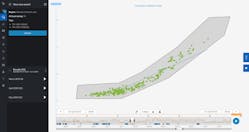
From the two identified operating zones, the engineers could see that after some construction work, the friction in a pressure pipe was significantly higher for the same flow rate. Based on this insight, an operation fingerprint of the normal operation region was defined and used to set a monitor to notify personnel of any changes in the overall behavior (Figure 3). This monitor would not only detect special cases such as increased friction but also detect other changes like clogging or significant leakages.
In addition to this specific use case, many benefits were also realized using advanced analytics, including:
- Prevention of major leaks, sinkholes, and clogging.
- Easier and more efficient process monitoring to indicate potential system problems.
- Significantly improved changes to the network’s overall behavior.
Ultimately, process experts had a deeper understanding of the process behavior within their pipe network which helped them address similar future cases.
Concluding Thoughts
Water, wastewater and process industries understand the challenges they face and can address these head-on by adopting and using advanced analytics. The process data is there; it only has to be fully leveraged to help experts more effectively and efficiently run their plants and monitor their processes. Operational action can thus be taken through data-driven insights, not through instinct or experience. WT
About the Author: Daniel Münchrath is a data analytics engineer at TrendMiner, a Software AG company. As part of the IoT & Analytics division, TrendMiner delivers self-service data analytics for time-series data enabling subject matter experts in the process manufacturing industry to analyze, monitor and predict process and asset performance in their operational context to improve operational excellence and overall profitability.


