Devices Clicks
The Devices clicks chart shows the split of clicks by device type. This helps you understand what kinds of devices your audience uses when they click your link.
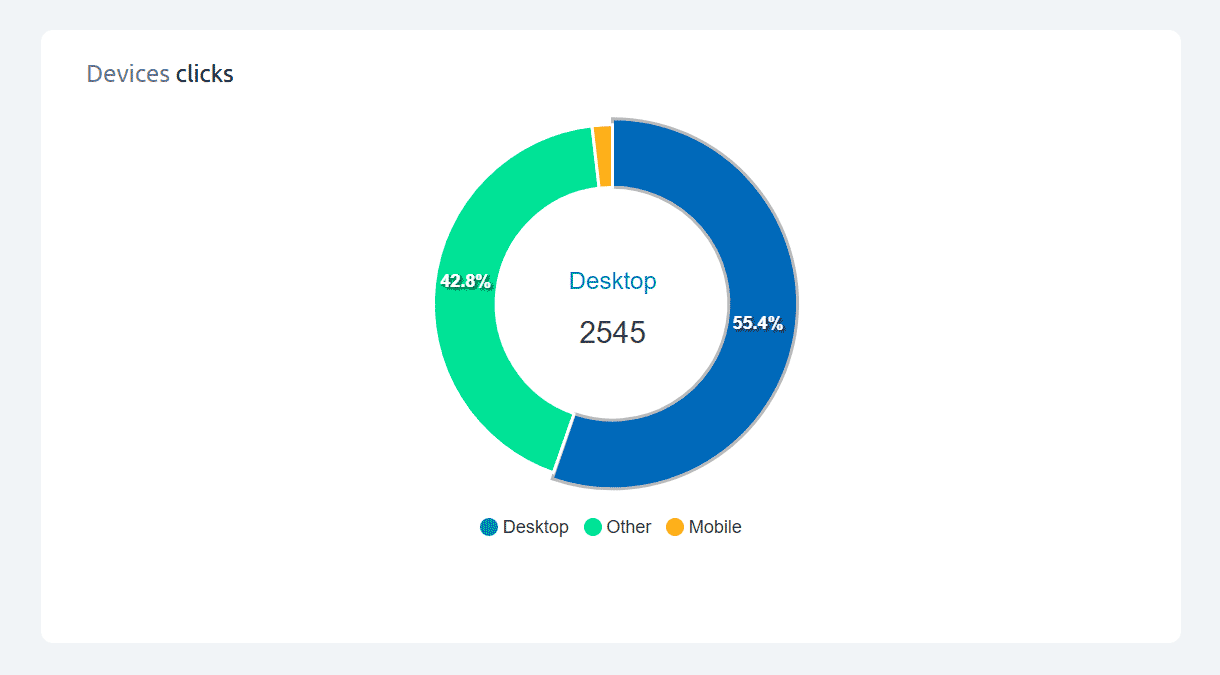
Detected device types:
Cuttly detects a wide range of device types from visitor user agents. The most common categories you will see are:
• Desktop — desktop and laptop computers
• Mobile — smartphones
• Tablet — tablet devices (iPad, Android tablets, etc.)
• TV — smart TVs and streaming devices
• Console — gaming consoles (PlayStation, Xbox, etc.)
• Car Browser — in-car browsers and infotainment systems
• Portable Media Player — dedicated media players
• Camera — connected cameras with browser capability
• Feature Phone — non-smartphone mobile phones
• Phablet — large-screen phones on the boundary between phone and tablet
• Smart Display — smart home displays and panels
• Smart Speaker — voice-controlled speakers with a browser
• Wearable — smartwatches and similar wearable devices
Device types that cannot be classified are grouped as Other.
The chart is displayed as a donut chart with percentage labels. Hovering over any segment shows the exact click count for that device type.
This data is useful for optimizing the destination page. If the majority of your clicks are coming from mobile devices, make sure the page your link redirects to is fully mobile-friendly.
For a more detailed breakdown by specific operating system, see the System (OS) clicks chart. For device brand and model data, see the Brand clicks chart.
Find out more about the options available in your subscription plan here: Cuttly pricing and features
FAQ
What device types does Cuttly detect?
Cuttly detects Desktop, Mobile, Tablet, TV, Console, Car Browser, Portable Media Player, Camera, Feature Phone, Phablet, Smart Display, Smart Speaker, Wearable, and others. Detection covers a very wide range of device types from user agent data.
How is the chart displayed?
As a donut chart with percentage labels. Hover over any segment to see the exact click count for that device type.
What is the most common device type?
It depends on how and where you share your links. Social media links typically skew mobile-heavy. Business email links often have a higher desktop share. The chart shows the actual split for your specific link and audience.
-
What is Link Analytics?
How to view link analytics?
Time range filter (7 / 30 / 90 days / All)
Total Clicks Chart
Hourly Insights Heat Map
Source of Clicks (Facebook, Twitter, Instagram, LinkedIn, Direct)
Referrals / Other Sources
Devices Clicks (Desktop / Mobile / Other)
System (OS) Clicks
Browsers Clicks
Brand Clicks
Languages Clicks
Geo Location Clicks
Bots
Public and Private Analytics
Analytics Settings (per-link and global)
Download Analytics Report (.PDF)
Aggregated Link Analytics
Campaign Tag Analytics