Hourly Insights Heat Map
The Hourly Insights section shows two side-by-side weekly heat maps — one for the previous week and one for the current week. Each heat map visualizes click activity broken down by day of week and hour of day, making it easy to see when your link is most active.
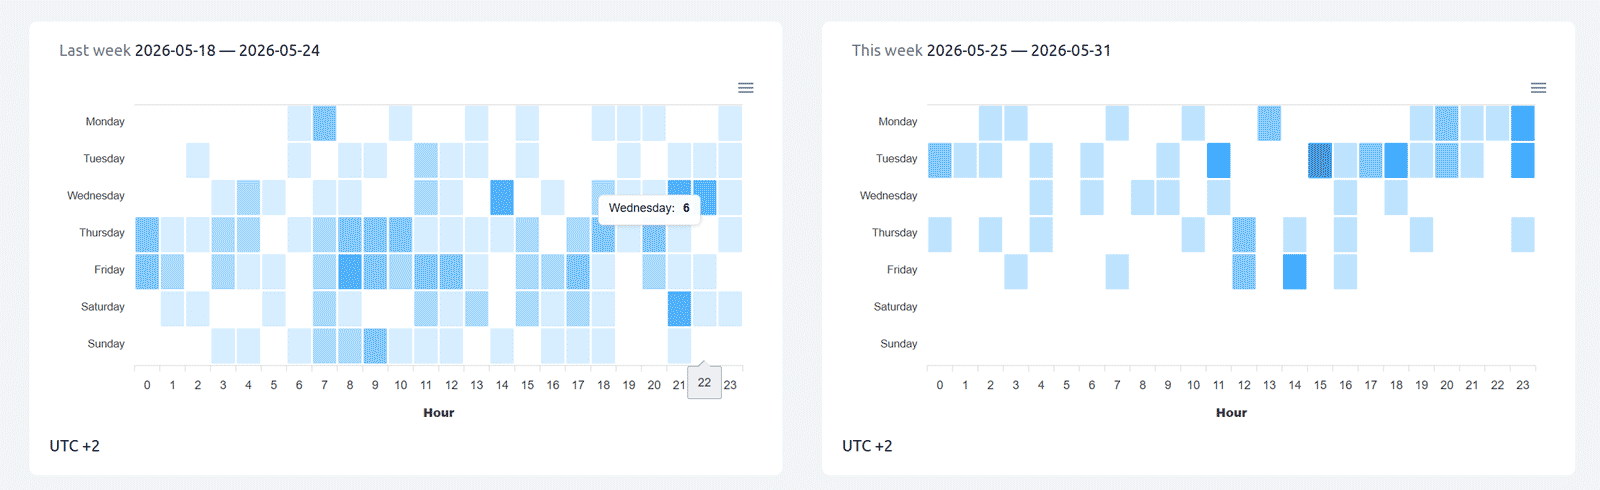
How to read the heat map:
• Rows = days of the week (Monday to Sunday)
• Columns = hours of the day (0 to 23)
• Color intensity = click volume — darker blue means more clicks at that day/hour combination
• Empty cells = no clicks recorded at that time
The heat maps help answer questions like:
- What hour of the day does my audience click the most?
- Which day of the week has the highest traffic on my link?
- Is activity shifting between last week and this week?
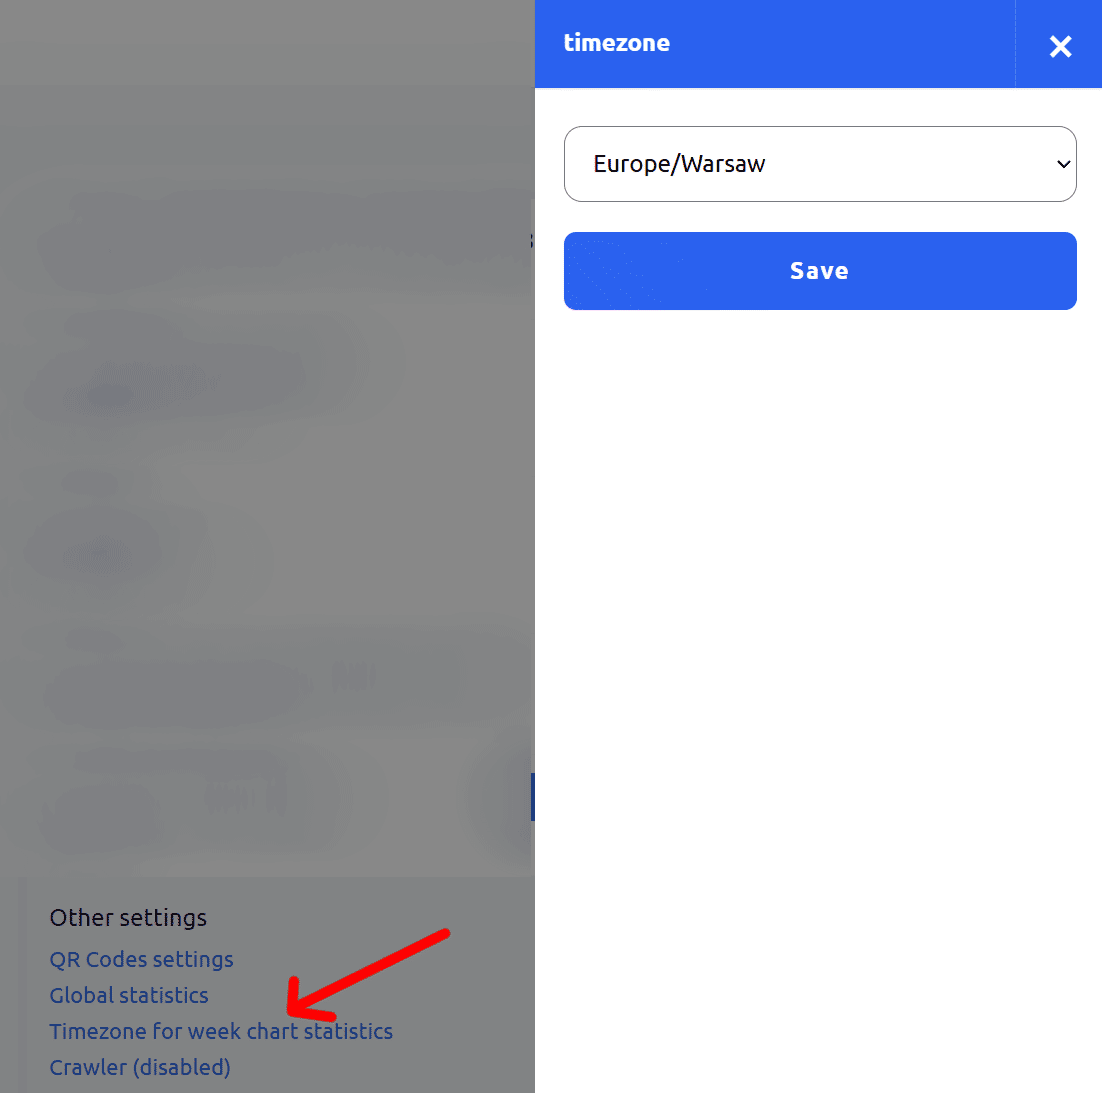
To change the timezone: go to your account settings → Other settings → Timezone for week chart statistics.
Plan availability:
Hourly Insights heat maps are available from the Single plan ($25/month).
Single: last 7 days of heat map data
Team: last 14 days
Team Enterprise: last 14 days
Not available on Free or Starter plans.
Find out more about the options available in your subscription plan here: Cuttly pricing and features
FAQ
What do the heat maps show?
Click activity by day of week and hour of day — darker cells mean more clicks at that time. Two heat maps are shown: one for the previous week and one for the current week.
Which plan includes Hourly Insights?
Available from the Single plan ($25/month). Single shows the last 7 days; Team and Team Enterprise show the last 14 days. Not available on Free or Starter.
Can I change the timezone for the heat maps?
Yes. Go to your account settings → Other settings → Timezone for week chart statistics. The current timezone is shown below each heat map (e.g. UTC +2). All other analytics charts are always shown in UTC.
-
What is Link Analytics?
How to view link analytics?
Time range filter (7 / 30 / 90 days / All)
Total Clicks Chart
Hourly Insights Heat Map
Source of Clicks (Facebook, Twitter, Instagram, LinkedIn, Direct)
Referrals / Other Sources
Devices Clicks (Desktop / Mobile / Other)
System (OS) Clicks
Browsers Clicks
Brand Clicks
Languages Clicks
Geo Location Clicks
Bots
Public and Private Analytics
Analytics Settings (per-link and global)
Download Analytics Report (.PDF)
Aggregated Link Analytics
Campaign Tag Analytics