How to view link analytics in Cuttly?
Every short link in Cuttly has a dedicated analytics page showing all click data for that link. Here is how to access it.
1. Log in to your Cuttly account and go to the main Dashboard.

2. Find the short link you want to analyze. Each link in the list shows a clicks counter on the right side (the blue number next to "clicks"). Click this counter — or click the bar chart icon in the row of action icons below the link — to open the analytics page.
3. The analytics page will open, showing Link analytics — last 30 days by default. At the top you will see the link title, the original URL, the short link, total click count, and the date the link was created.
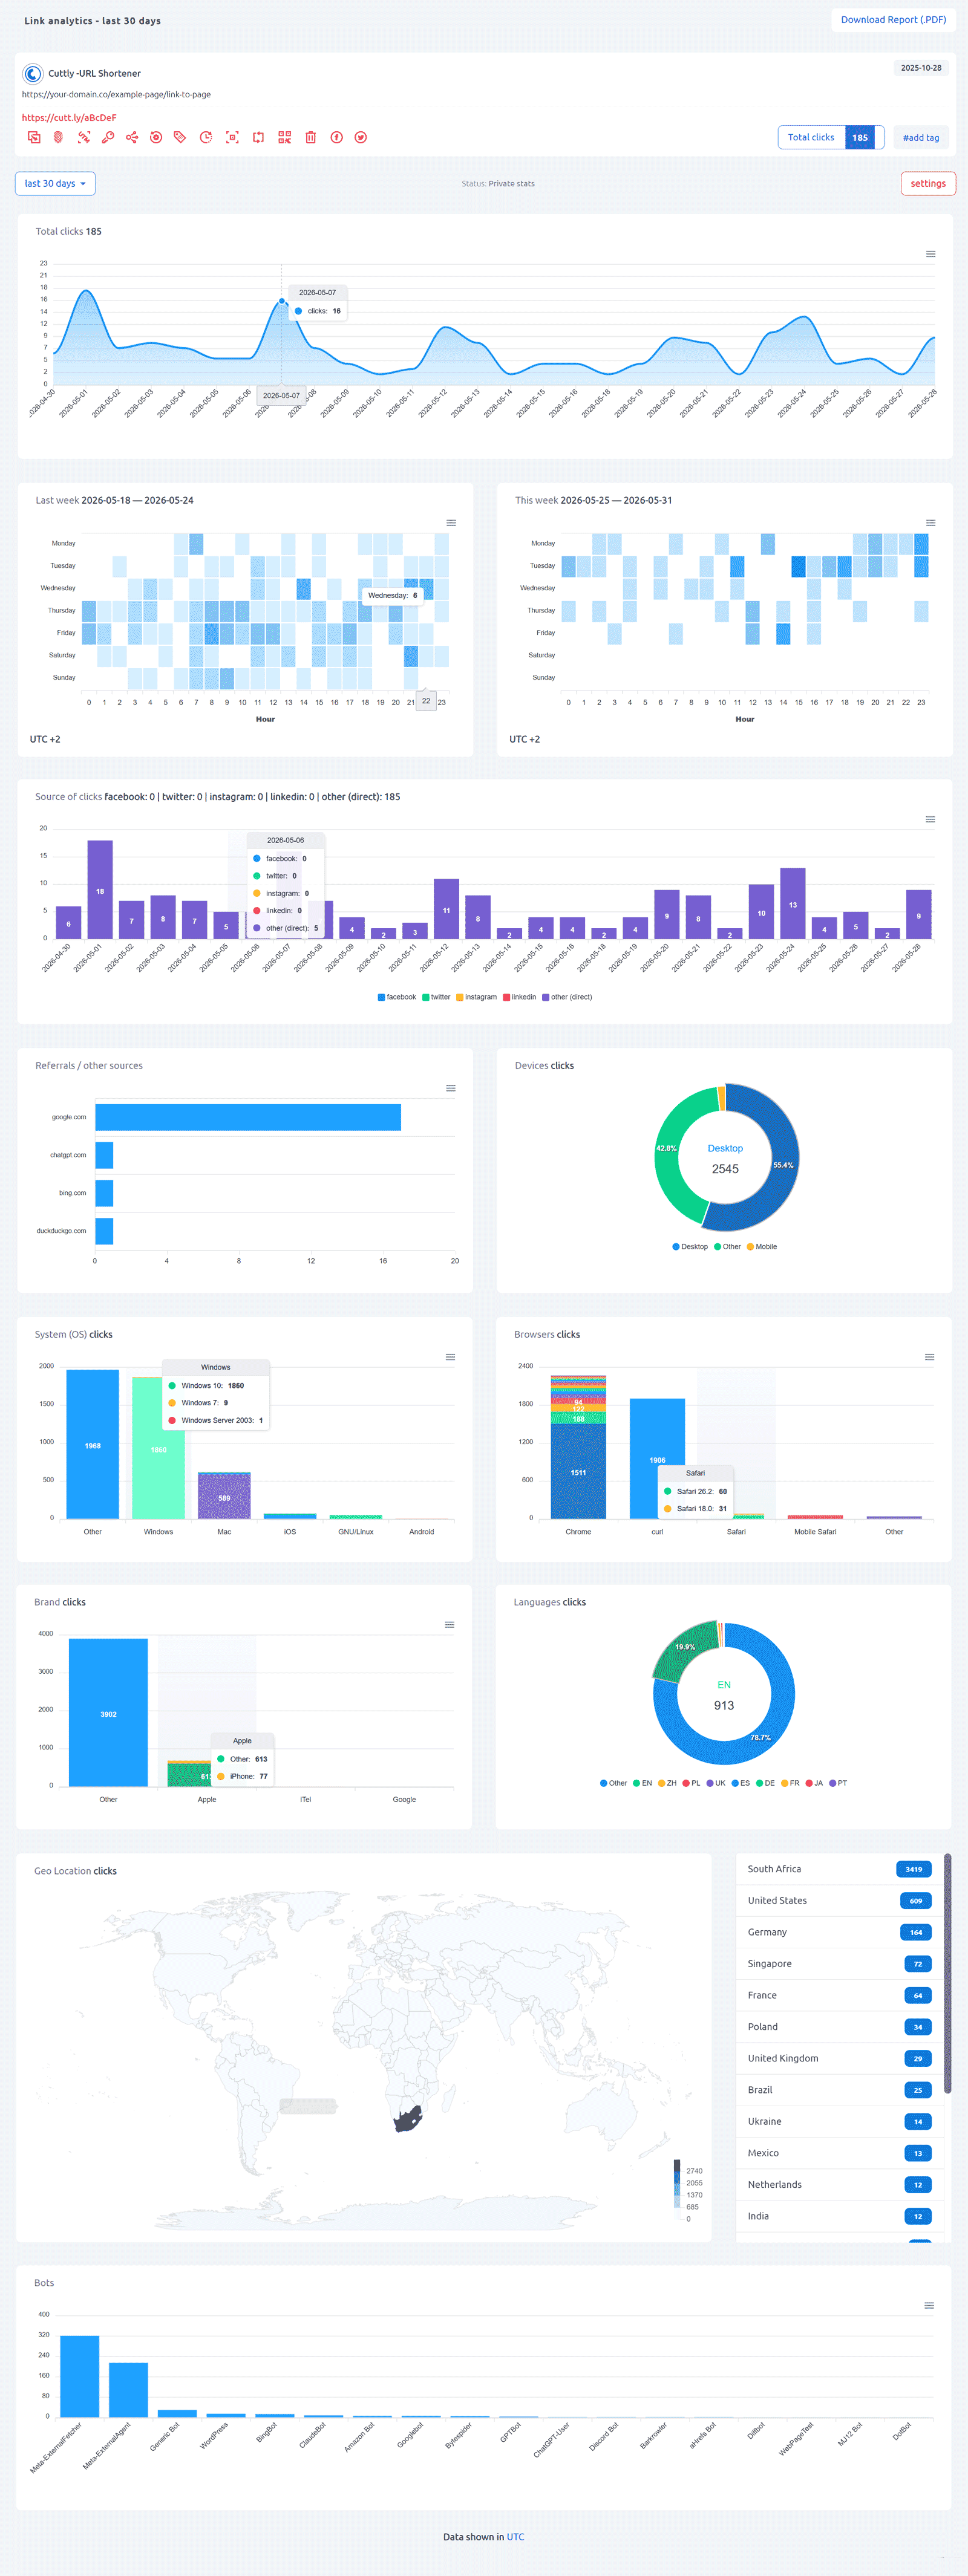
4. Below the link header, use the time range selector (top left of the analytics area) to choose the period you want to view: last 7 days, last 30 days, last 90 days, or All clicks.
5. Scroll down to see all charts: total clicks by day, hourly heat maps (Single plan+), source of clicks, referrals, devices, OS, browsers, brands, languages, geo-location map, and bots.
6. Each chart has a download button (hamburger icon, top right of each chart) to export the individual chart as an image. You can also download the full analytics report as a PDF — see How to download a link analytics report as PDF.
All analytics data is shown in UTC by default. You can change the timezone for the weekly heat map charts in your account settings.
Find out more about the options available in your subscription plan here: Cuttly pricing and features
FAQ
Where is the analytics button in the dashboard?
Each link in the dashboard list has a row of action icons below it and a click counter on the right. Click either the bar chart icon or the blue clicks counter to open the analytics page for that link.
Can I access account-level aggregated analytics?
Yes. Under Link Management → Aggregated Link Analytics in the sidebar you can view account-wide analytics: total clicks across all links, top links by clicks, top devices, top countries, top languages and more. Available from the Single plan.
What time zone is used for analytics?
All click data is shown in UTC. The timezone for the weekly hourly heat map charts can be adjusted in your account settings under Other settings → Timezone for week chart statistics.
-
What is Link Analytics?
How to view link analytics?
Time range filter (7 / 30 / 90 days / All)
Total Clicks Chart
Hourly Insights Heat Map
Source of Clicks (Facebook, Twitter, Instagram, LinkedIn, Direct)
Referrals / Other Sources
Devices Clicks (Desktop / Mobile / Other)
System (OS) Clicks
Browsers Clicks
Brand Clicks
Languages Clicks
Geo Location Clicks
Bots
Public and Private Analytics
Analytics Settings (per-link and global)
Download Analytics Report (.PDF)
Aggregated Link Analytics
Campaign Tag Analytics