System (OS) Clicks
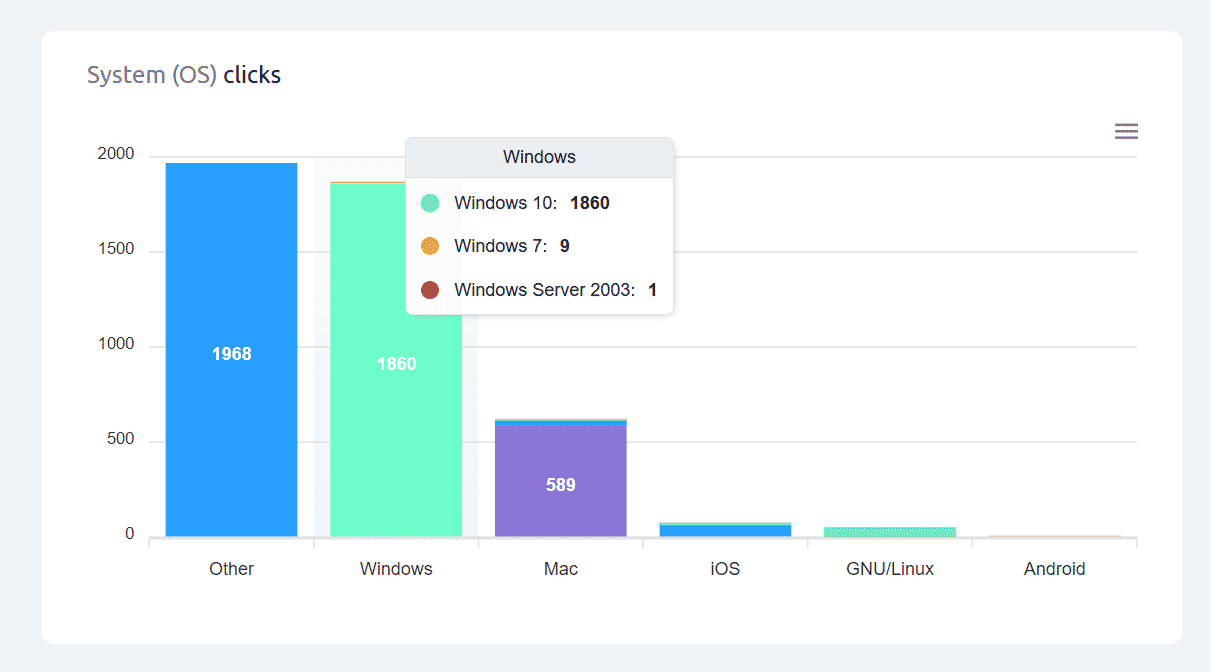
The System (OS) clicks chart shows which operating systems the people clicking your short link are using. It provides a detailed OS-level view of your audience — with version breakdowns accessible on hover.
Cuttly detects a very wide range of operating systems from user agent data. Common examples you will see include:
• Windows — all versions, including Windows 10, Windows 11, Windows 7, Windows Server editions
• macOS — all macOS versions
• iOS — iPhone and iPad operating system, by version
• Android — Android mobile and tablet OS, by version
• Linux — Linux-based systems including various distributions
• ChromeOS — Chromebook operating system
• KaiOS — feature phone platform
• HarmonyOS — Huawei devices
• Tizen — Samsung smart TVs and wearables
• webOS — LG smart TVs
• And many more operating systems detected from user agent strings
Version breakdown on hover: Hover over any OS bar to see a tooltip with the version-level breakdown. For example, hovering over Windows shows Windows 10, Windows 11, Windows 7, and other versions with their individual click counts. This detail is useful for understanding whether legacy OS versions still represent meaningful traffic on your links.
The chart is displayed as a grouped vertical bar chart. The Y-axis shows click count; each bar represents one OS group. OS types that cannot be classified are grouped as Other.
Find out more about the options available in your subscription plan here: Cuttly pricing and features
FAQ
Which operating systems does Cuttly detect?
A very wide range — Windows (all versions), macOS, iOS, Android, Linux, ChromeOS, KaiOS, HarmonyOS, Tizen, webOS, and many more. Detection is based on user agent parsing and covers virtually all common operating systems and many less common ones.
How do I see OS version details?
Hover over any OS bar. A tooltip shows the version-level breakdown — for example Windows 10, Windows 11, Windows 7 each with their click counts.
Why is "Other" sometimes a large bar?
"Other" groups OS types that were detected but fall outside the main displayed categories — or user agents where the OS cannot be specifically classified. A high "Other" count in technical or API use cases is normal.
-
What is Link Analytics?
How to view link analytics?
Time range filter (7 / 30 / 90 days / All)
Total Clicks Chart
Hourly Insights Heat Map
Source of Clicks (Facebook, Twitter, Instagram, LinkedIn, Direct)
Referrals / Other Sources
Devices Clicks (Desktop / Mobile / Other)
System (OS) Clicks
Browsers Clicks
Brand Clicks
Languages Clicks
Geo Location Clicks
Bots
Public and Private Analytics
Analytics Settings (per-link and global)
Download Analytics Report (.PDF)
Aggregated Link Analytics
Campaign Tag Analytics